Troubleshooting Parca Agent
Web UI
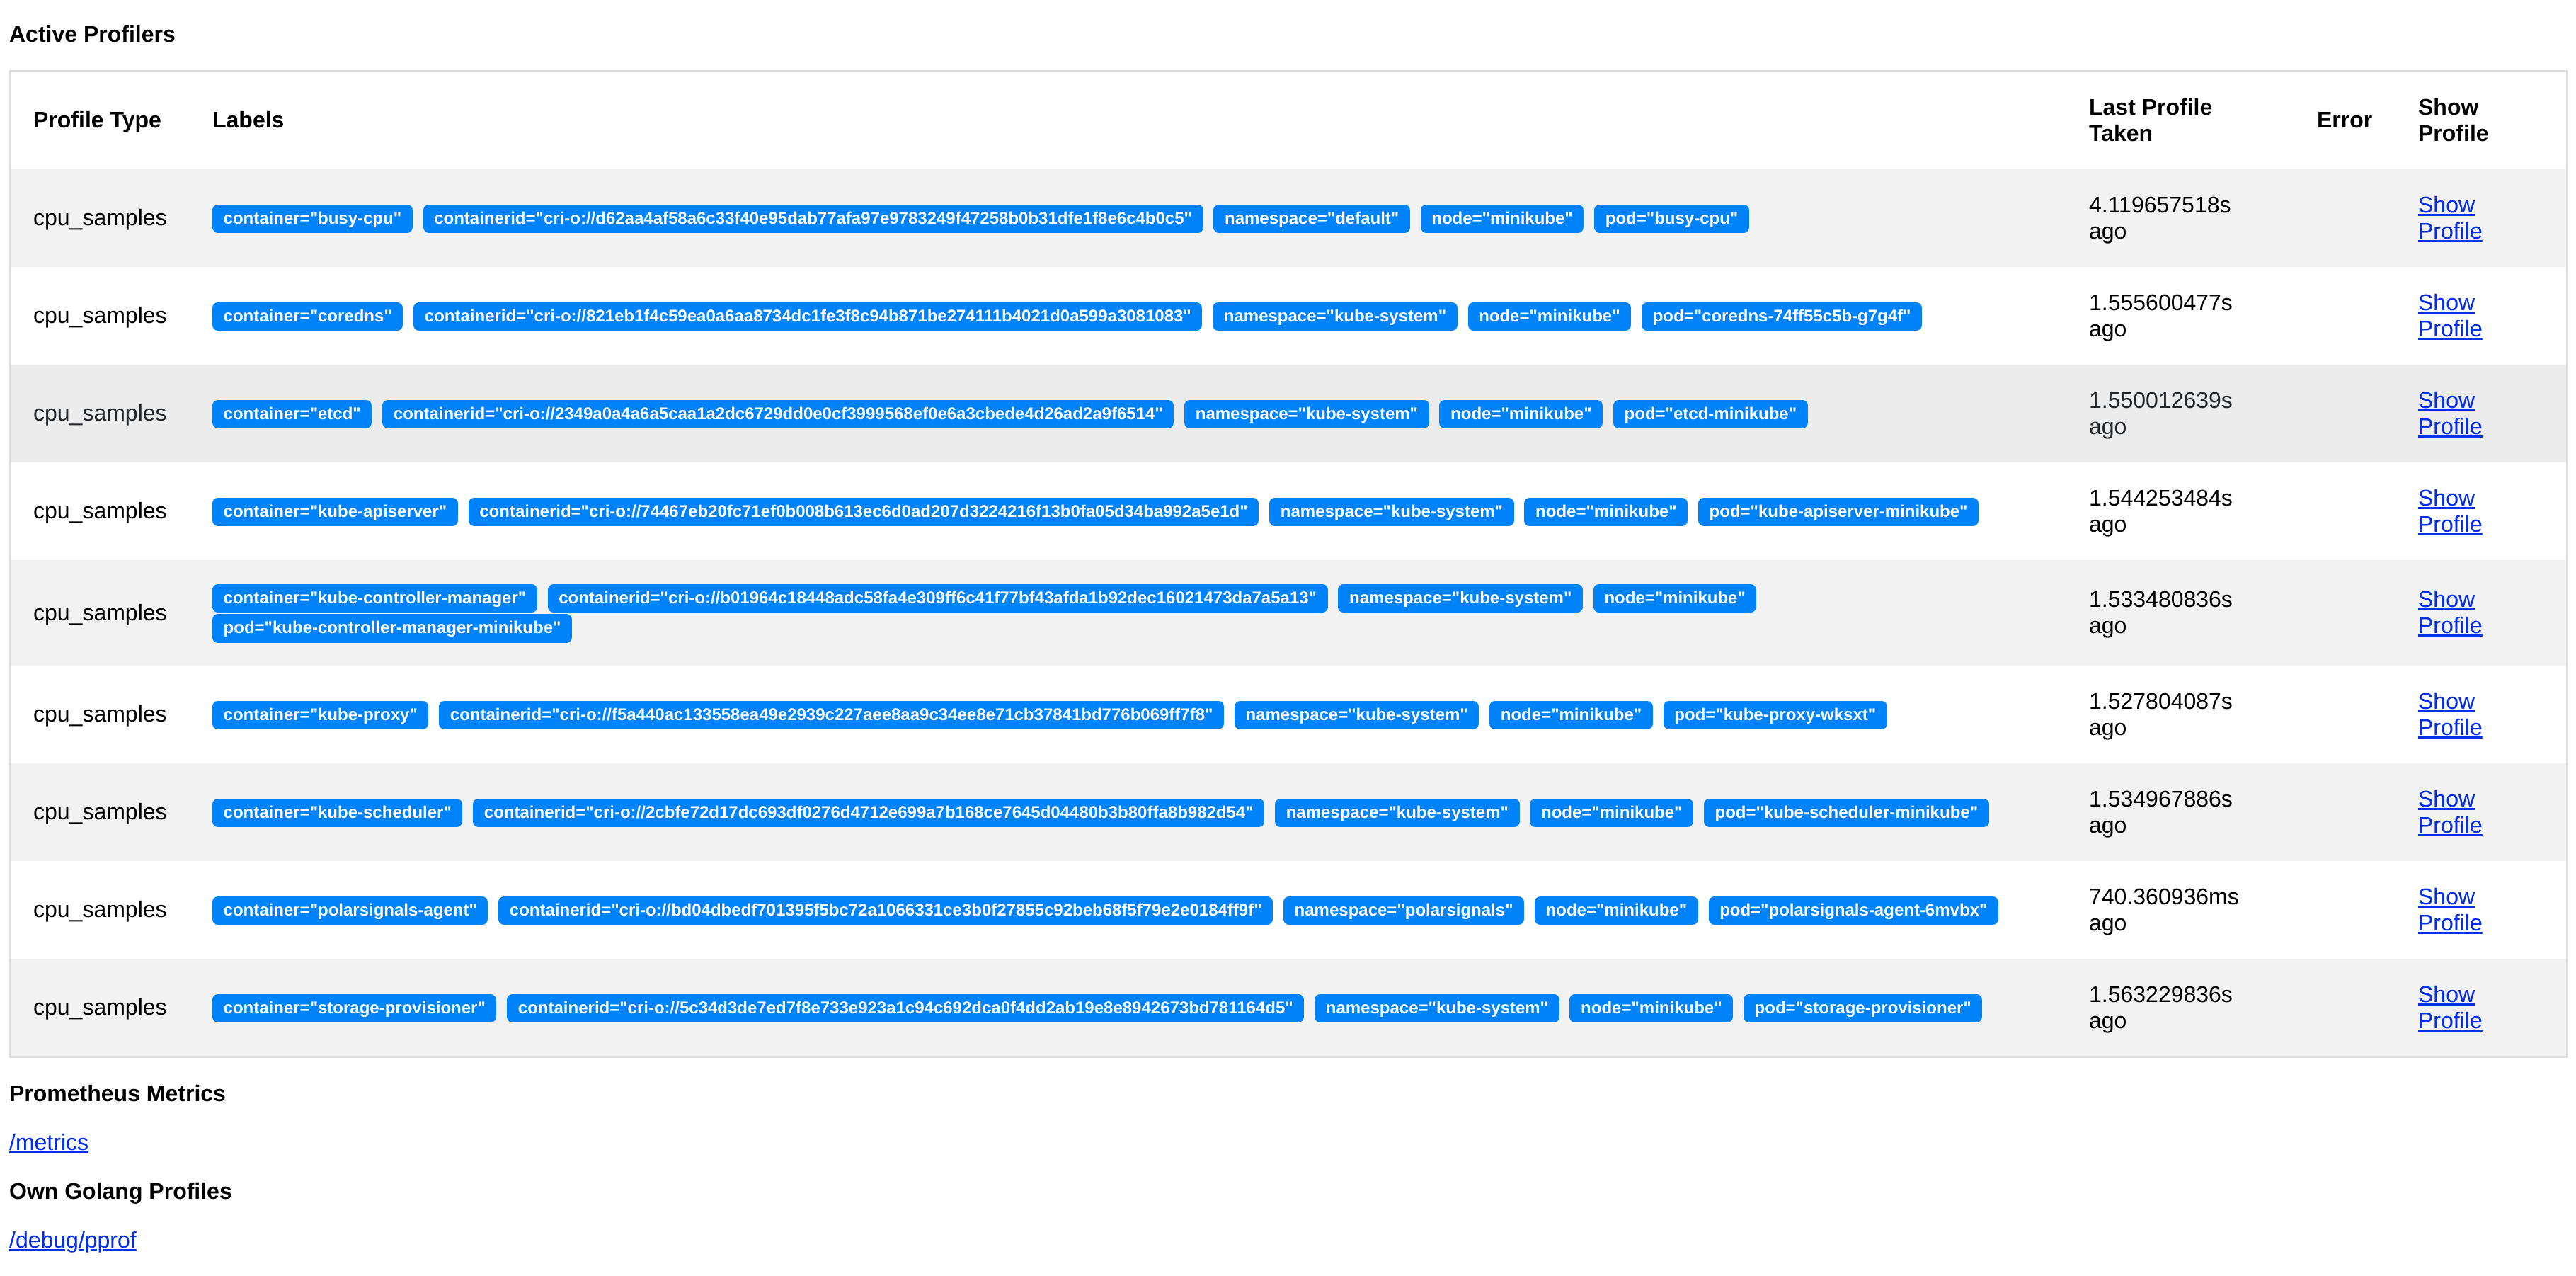
The HTTP endpoints can be used to inspect the active profilers by visiting port 7071 of the process (the host-port that the agent binds to can be configured using the --http-address flag).
For example, that might look like the following:
And all the discovered processes:
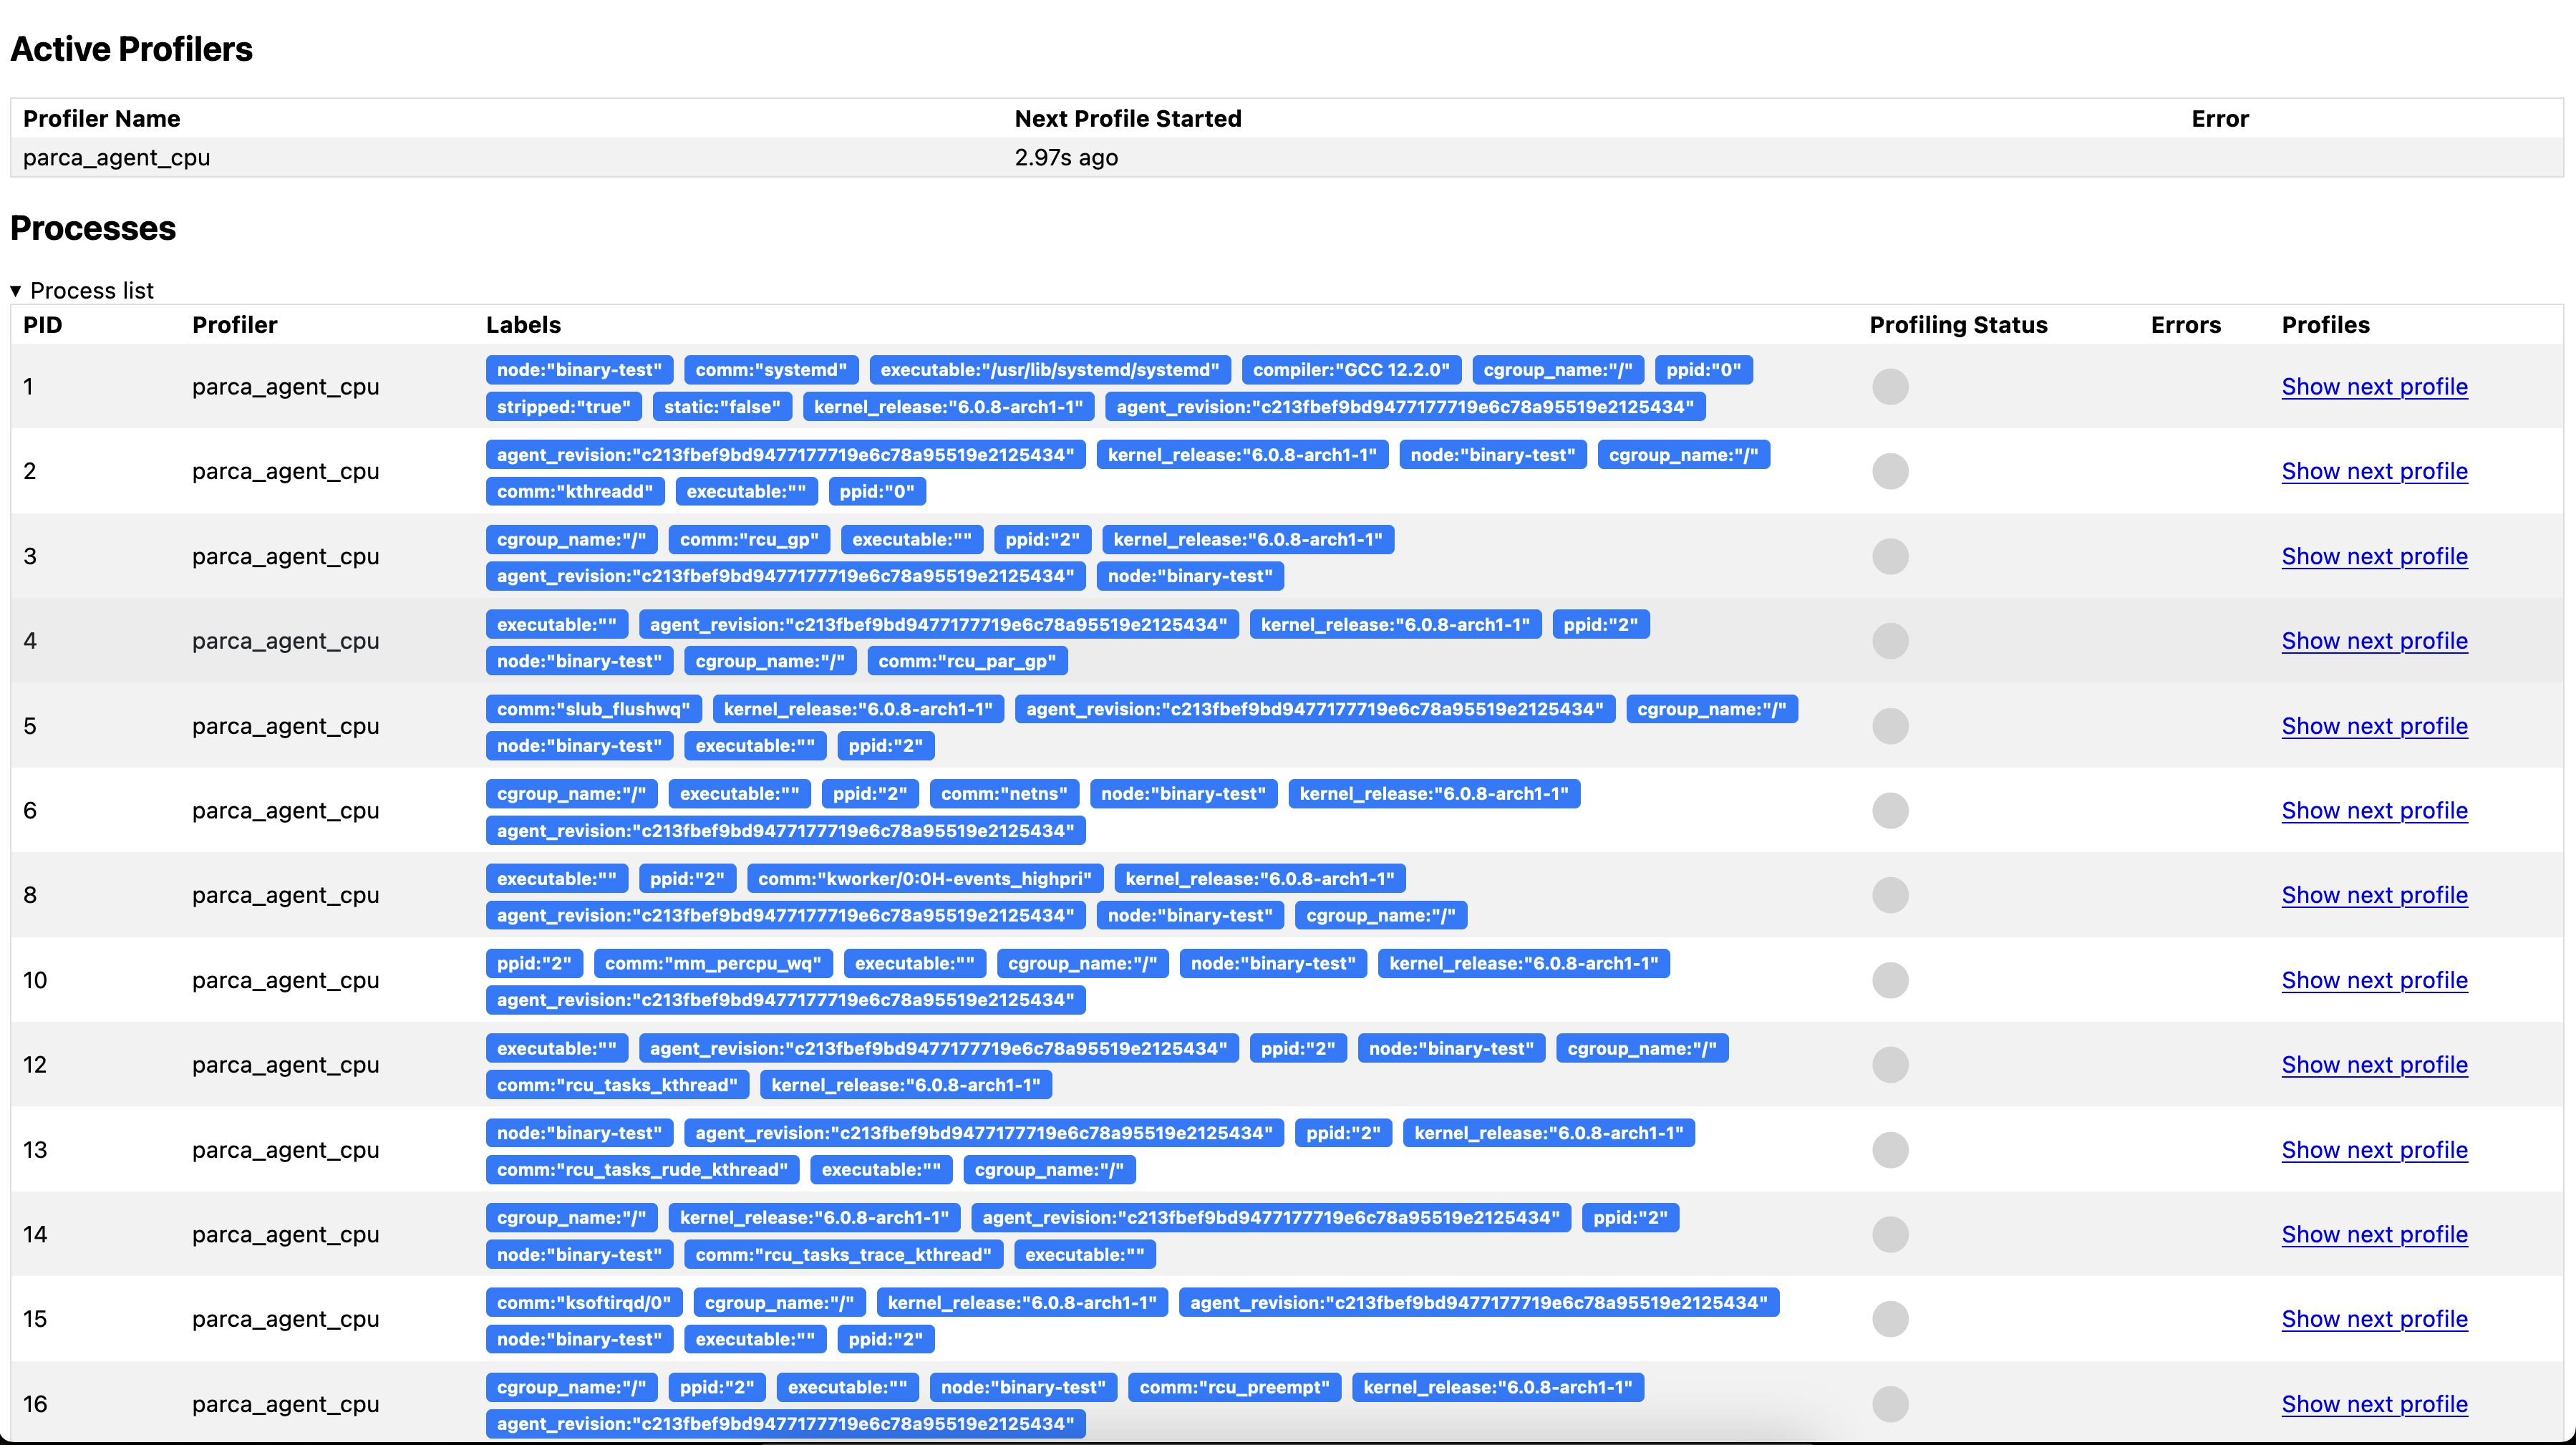
And by clicking "Show next profile" in one of the rows, the currently collected profile will be rendered once the collection finishes (this can take up to 10 seconds).
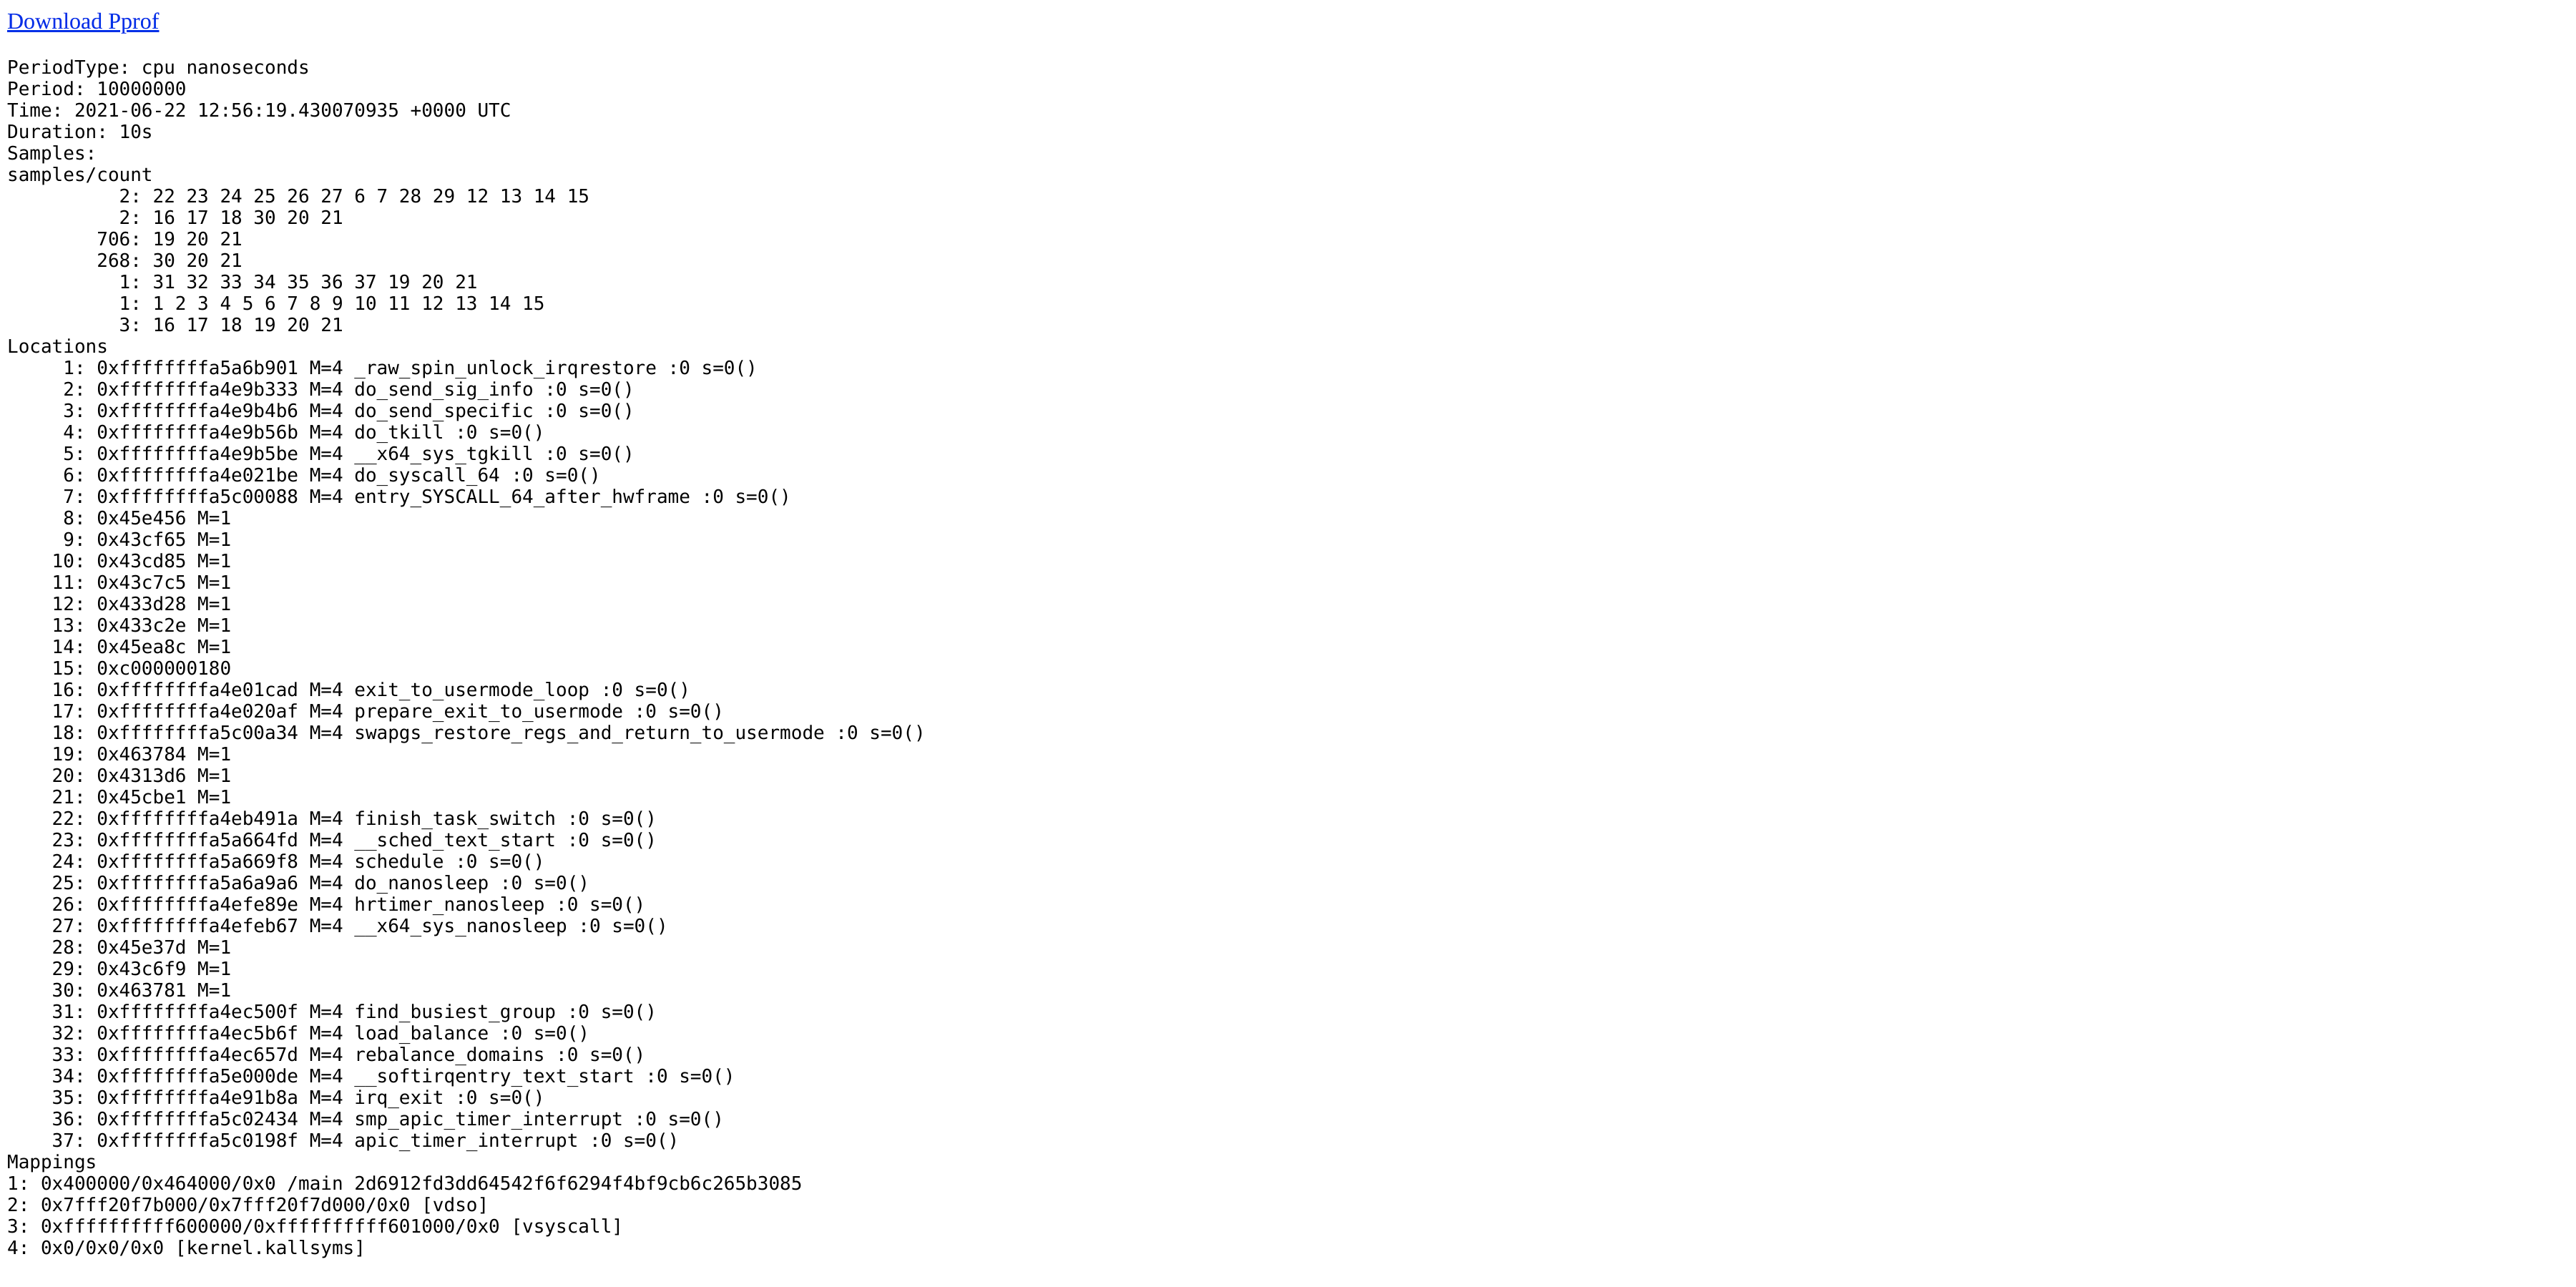
A raw profile can also be downloaded here by clicking "Download Pprof". Note that in the case of native stack traces such as produced from a compiled language like C, C++, Go, Rust, etc., are not symbolized, and if this pprof profile is analyzed using the standard pprof tooling, the symbols will need to be available to the tooling.
Logging
To debug potential errors, enable the debug logging using --log-level=debug.
To reach out to eBPF program logs use bpftool prog tracelog. You could also find the following document useful for further troubleshooting techniques using bpftool: https://qmonnet.github.io/whirl-offload/2021/09/23/bpftool-features-thread