Kubernetes
You can find interactive version of this tutorial at our Katacoda account. Check it out here.
To quickly try out the Parca and Parca Agent with Kubernetes, you create a Colima cluster with Kubernetes:
# Homebrew
brew install colima

colima start --kubernetes
The Agent needs to access to Kernel and run as a privileged user to load necessary eBPF programs. Please check our FAQ for further information.
Setting up Parca Server
Start by creating a namespace for Parca components to run in.
kubectl create namespace parca
Creating this namespace is not strictly necessary, but it prevents a race with the following commands, to make the guide more smooth.
To provision the Parca against any Kubernetes cluster, and use the API and UI:
kubectl apply -f https://github.com/parca-dev/parca/releases/download/v0.28.0/kubernetes-manifest.yaml
You can verify by selecting pods if everything runs as expected:
kubectl get pods -n parca

NAMESPACE     NAME                            READY   STATUS    RESTARTS   AGE
parca         parca-5f879c46ff-pv649          1/1     Running   0          53m
To view the Parca UI and access the API, we can port-forward using the default port 7070:
kubectl -n parca port-forward service/parca 7070
Once the Parca is running, and you set up the port-forwarding. Now you can navigate through to the web interface on the browser by visiting visit http://localhost:7070.
However, at this stage, you shouldn't see any data. Parca hasn't ingested any data because we haven't configured any data source.
So let's set up Parca Agent in our cluster and collect data from our cluster.
Setting up Parca Agent
First, let's make sure the namespace we are going to use is created (if you haven't already done this in the previous step):
kubectl create namespace parca
Creating this namespace is not strictly necessary, but it prevents a race with the following commands, to make the guide more smooth.
To provision the Parca Agent as a DaemonSet:
kubectl apply -f https://github.com/parca-dev/parca-agent/releases/download/v0.49.0/kubernetes-manifest.yaml
You can verify by selecting pods if everything runs as expected:
kubectl get pods -n parca

NAME                        READY   STATUS    RESTARTS   AGE
parca-5f879c46ff-pv649      1/1     Running   0          54m
parca-agent-b66vt           1/1     Running   0          54m
Let's set up a port-forward using the default port 7071.
kubectl -n parca port-forward `kubectl -n parca get pod -lapp.kubernetes.io/name=parca-agent -ojsonpath="{.items[0].metadata.name}"` 7071
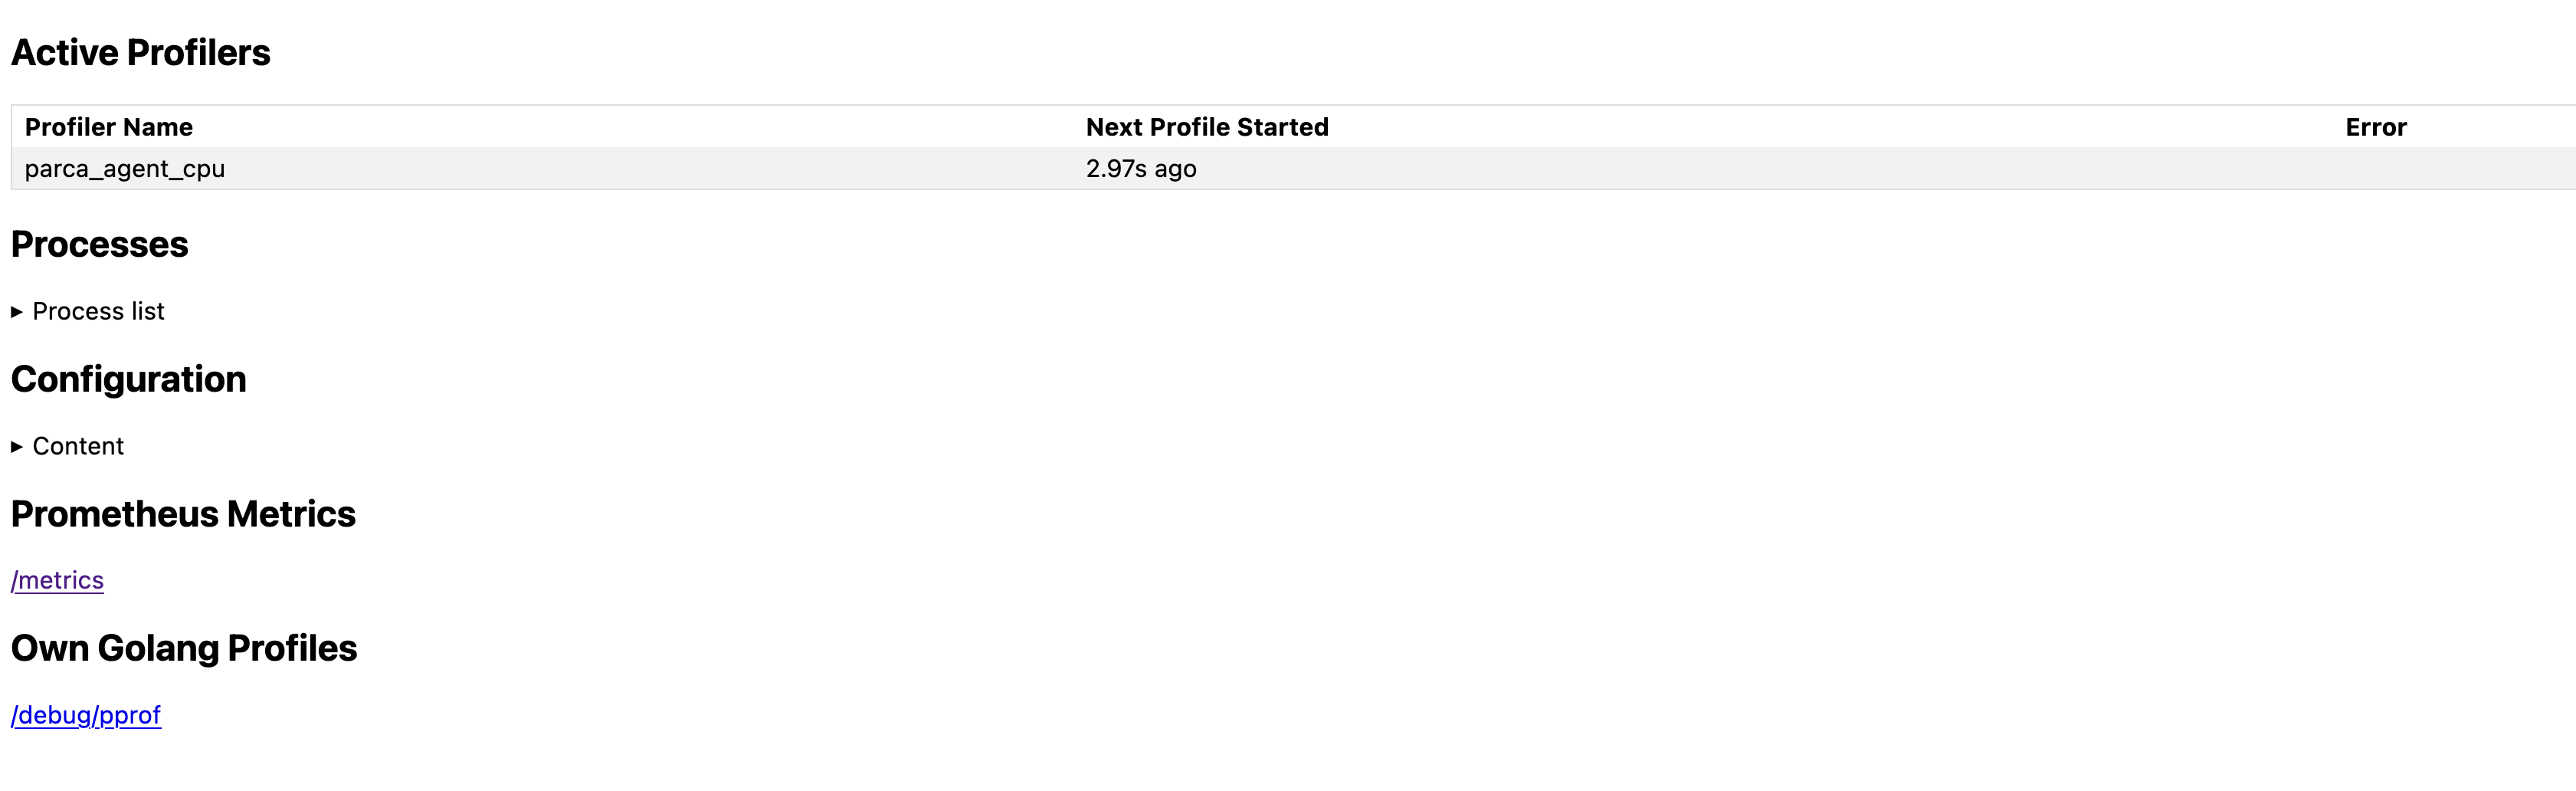
Now we can view the active profilers by visiting http://localhost:7071:
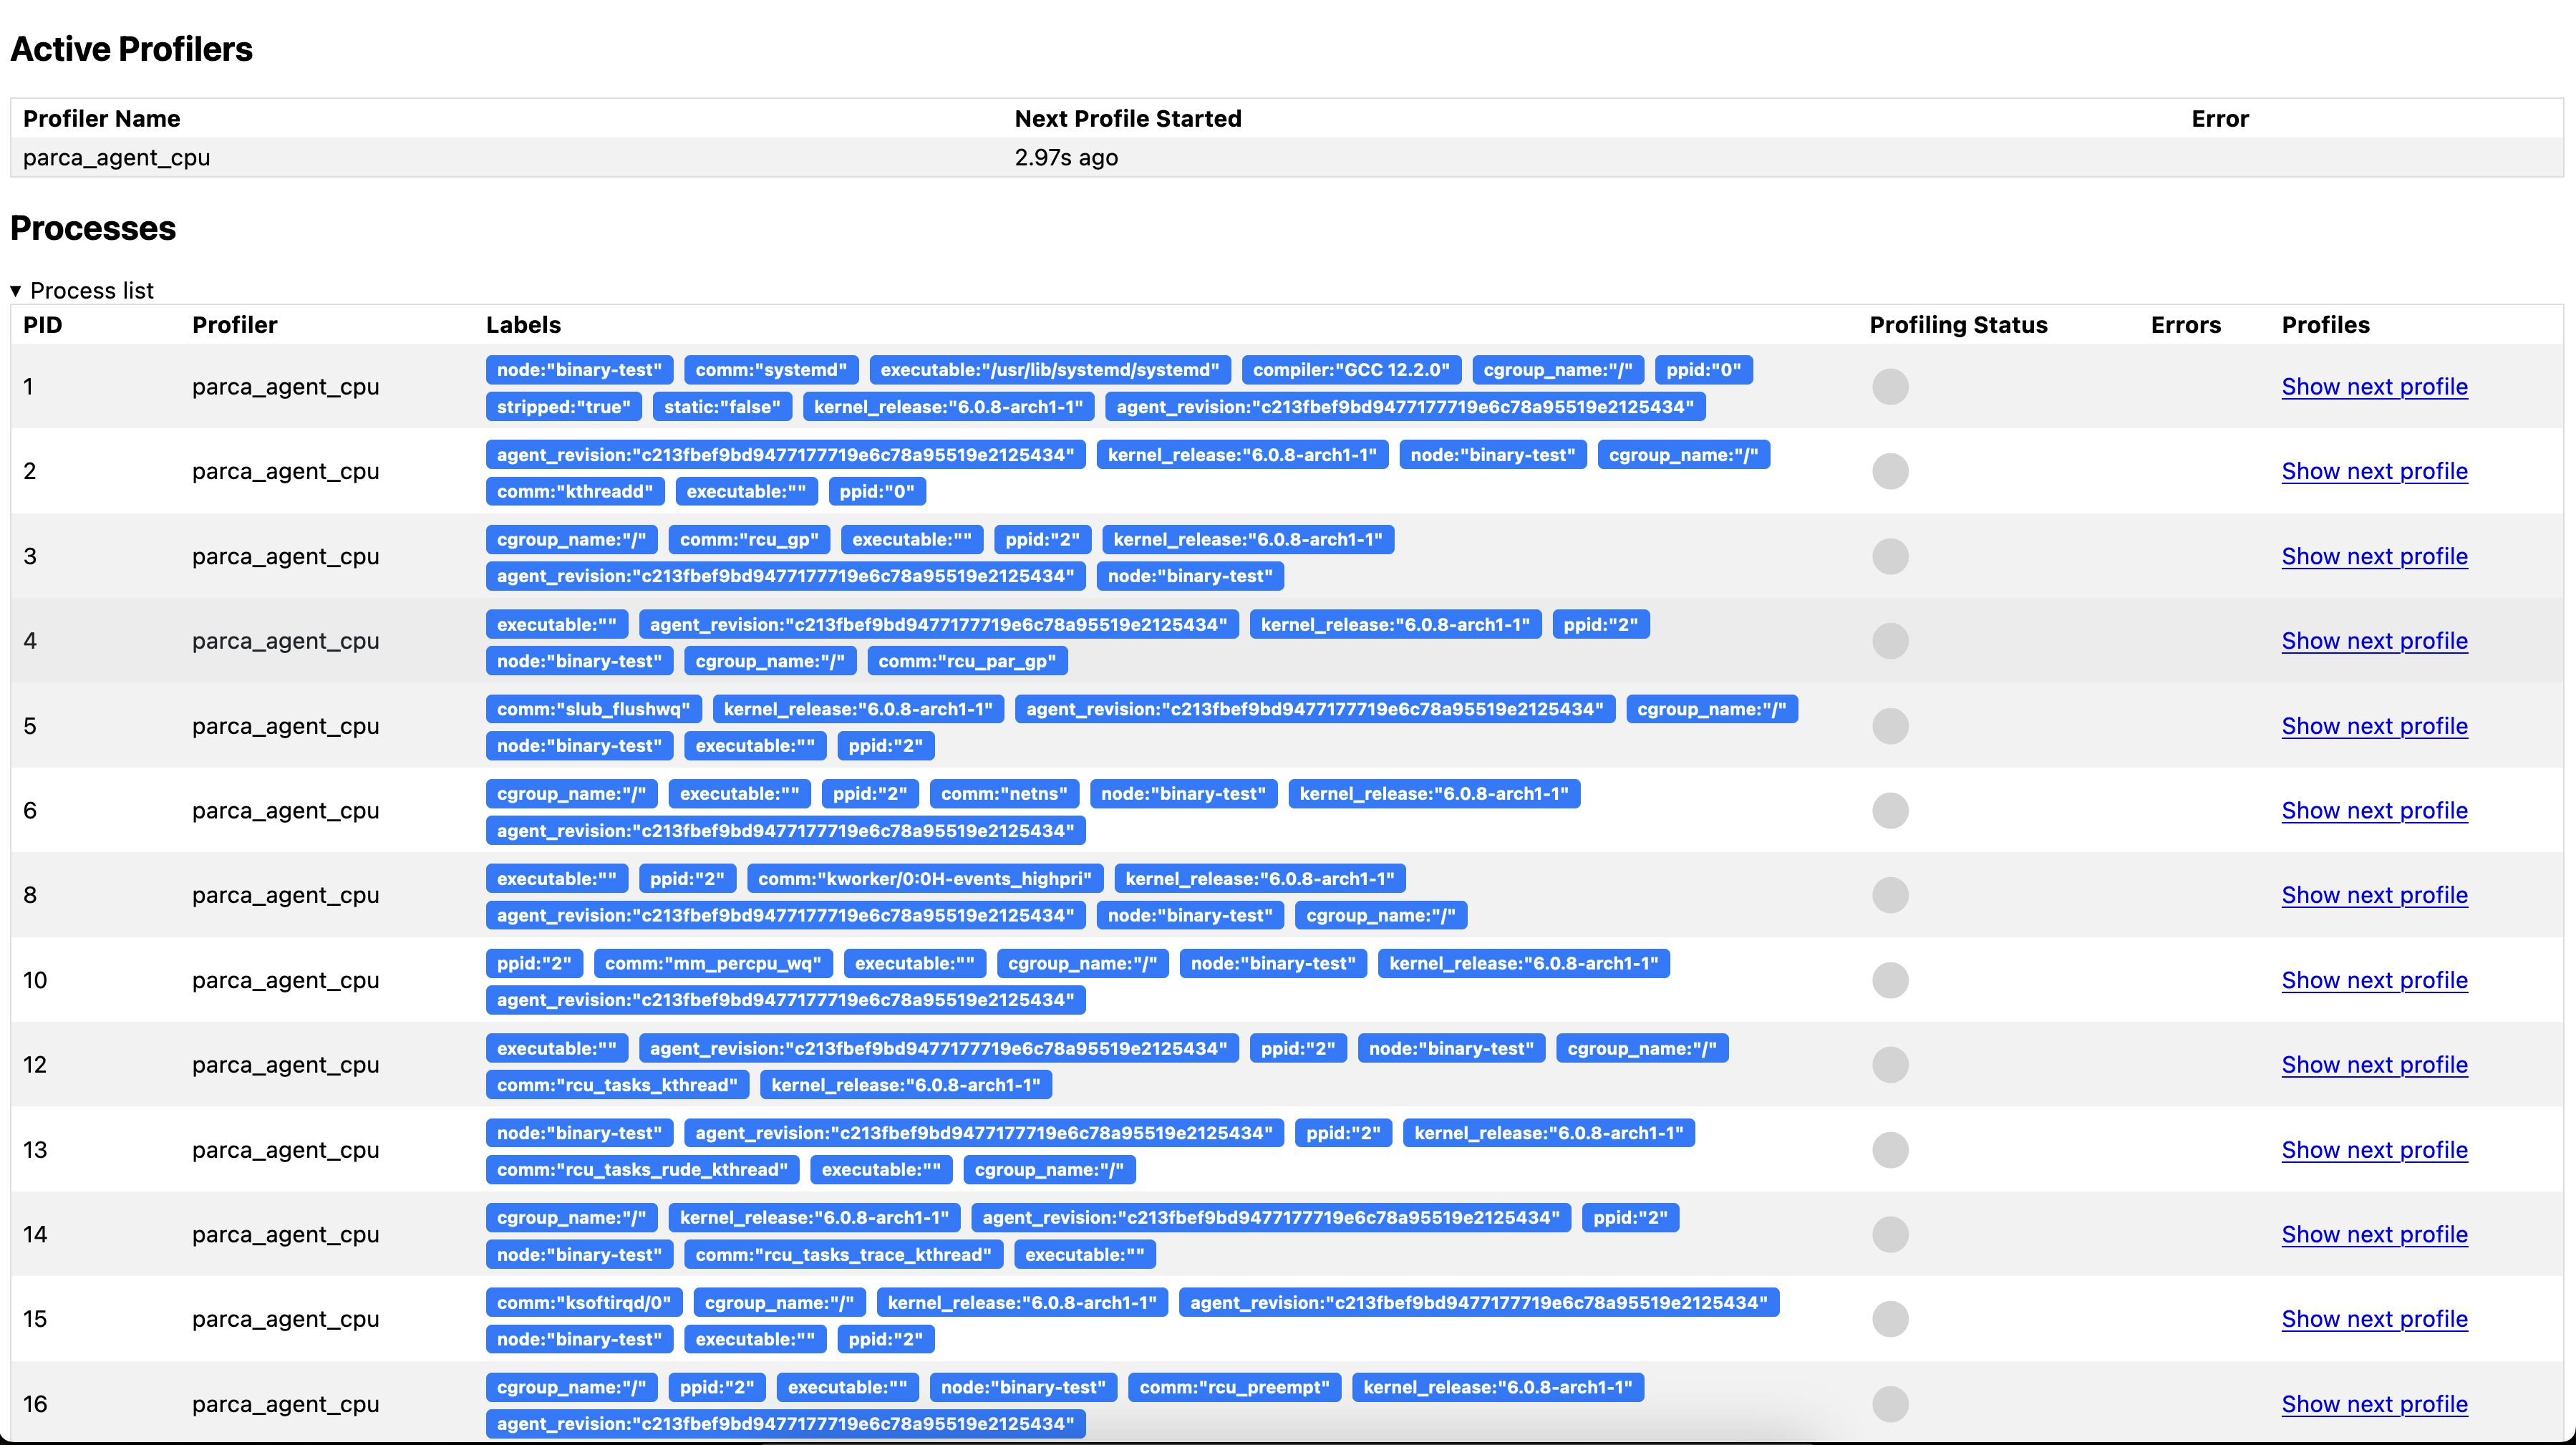
And all the discovered processes:
To continuously send every profile collected to a Parca server configure the --remote-store-address and the potential credentials needed.
For example, to send to a Parca server in the parca namespace set: --remote-store-address=parca.parca.svc:7070.
This has already been set up for our current setup in the previously applied manifests.
You can use --remote-store-insecure and --remote-store-insecure-skip-verify for simpler setups.
      --remote-store-insecure     Send gRPC requests via plaintext instead of
                                  TLS.
      --remote-store-insecure-skip-verify
                                  Skip TLS certificate verification.
Exploring the collected data
Once Parca and Parca Agent are both running, you can navigate to the web interface on the browser.
You should shortly see the Select profile... dropdown menu populate with the profiles that Parca is retrieving from itself and receiving from the Agent.
Parca supports any pprof formatted profile, but here we are demonstrating Parca Agent's automatic profiling with zero-instrumentation, which currently only supports CPU profiling.
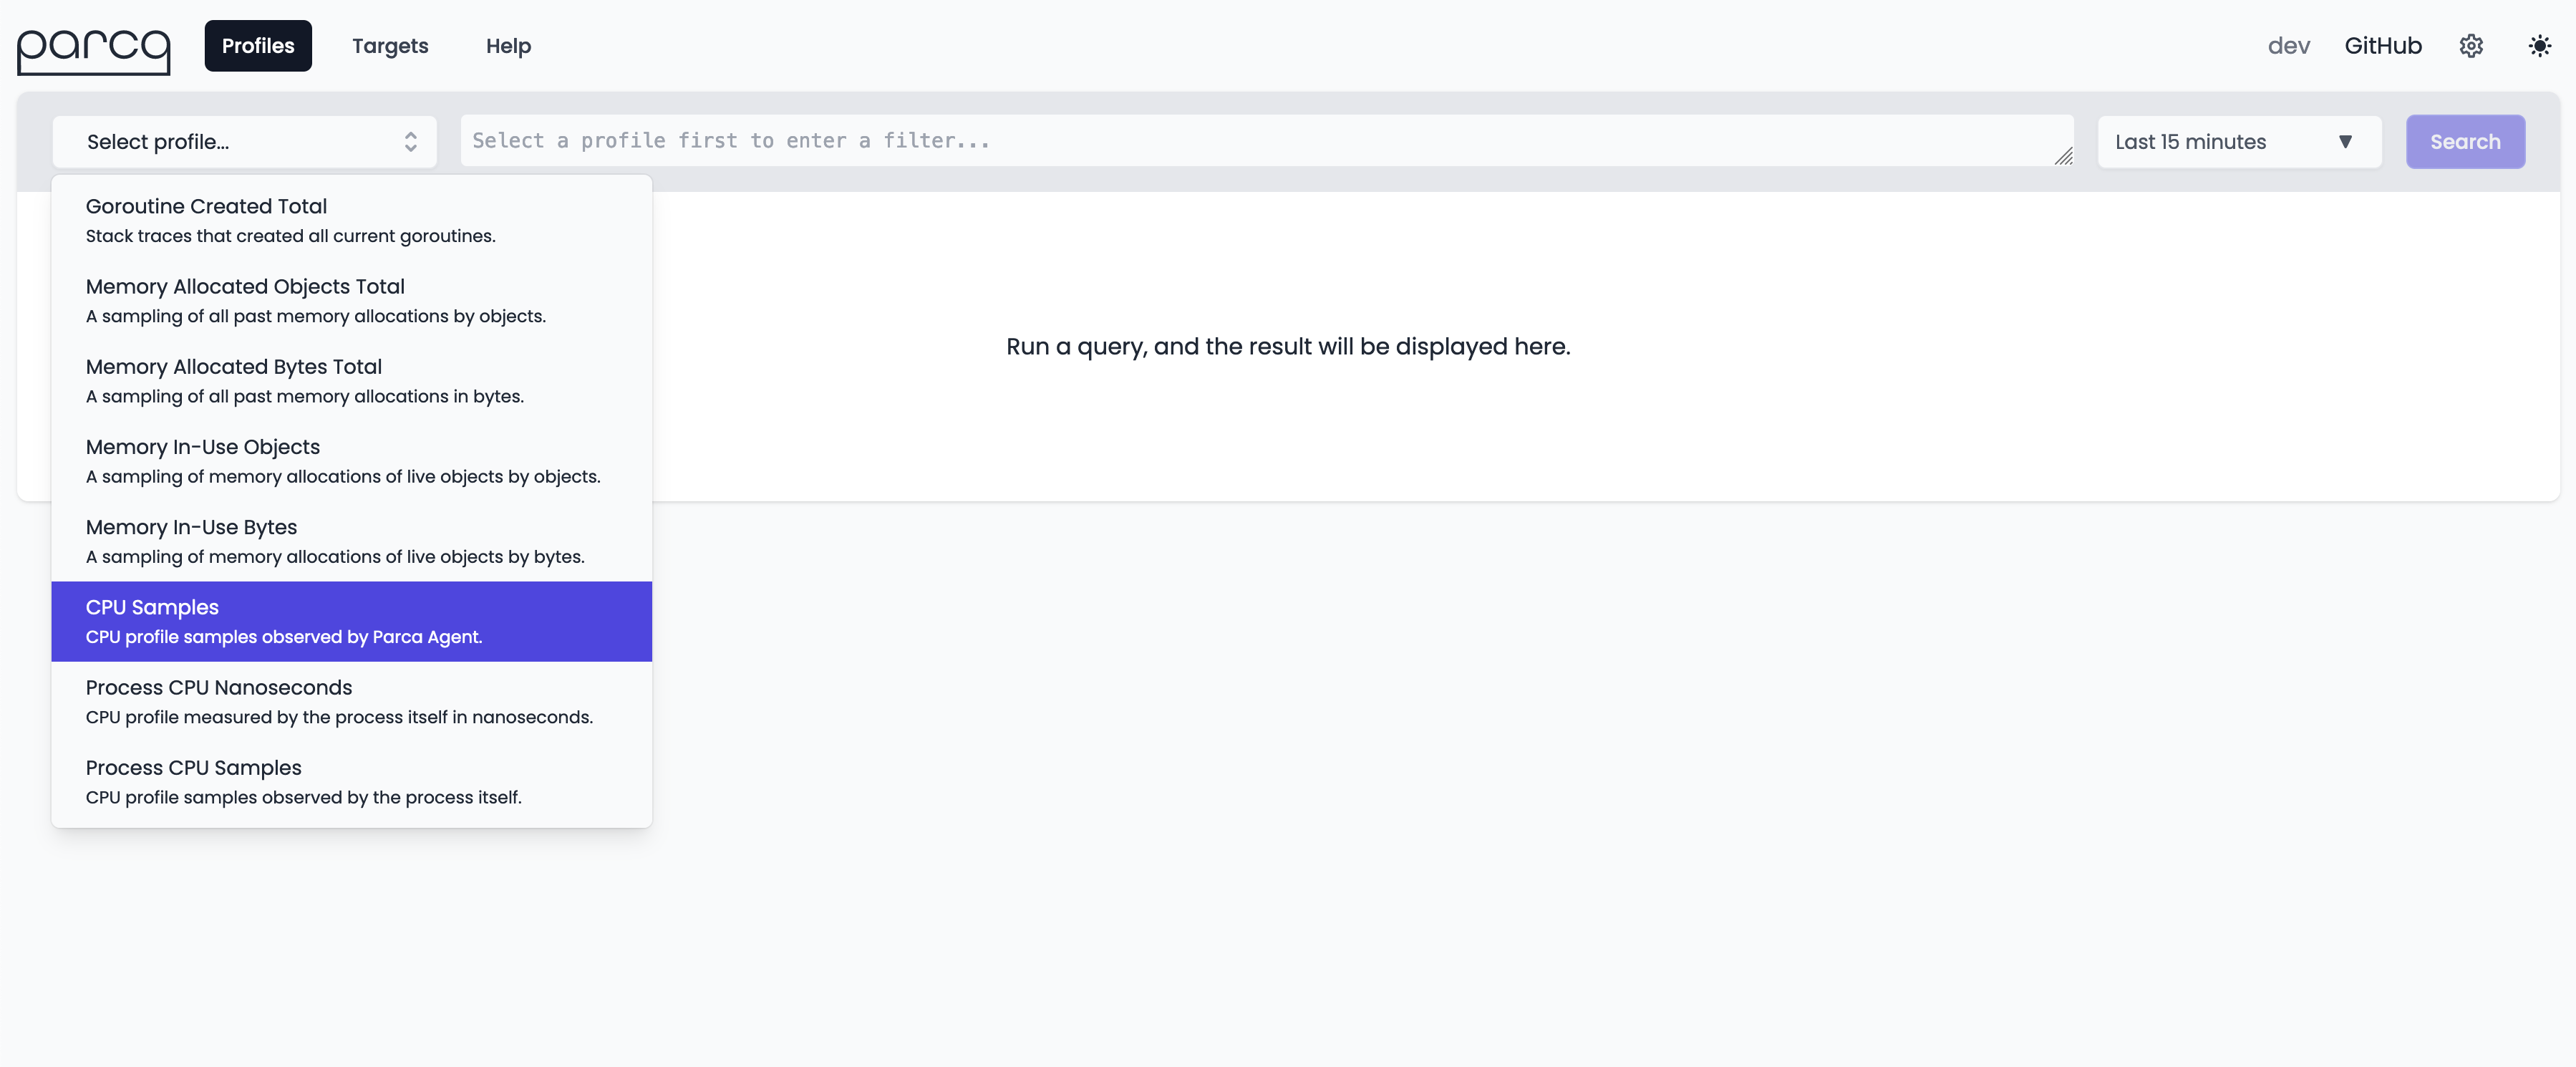
Selecting CPU Samples as profile type and clicking the Search button will retrieve the profiles from Parca Agent for the time selection (default Last Hour).
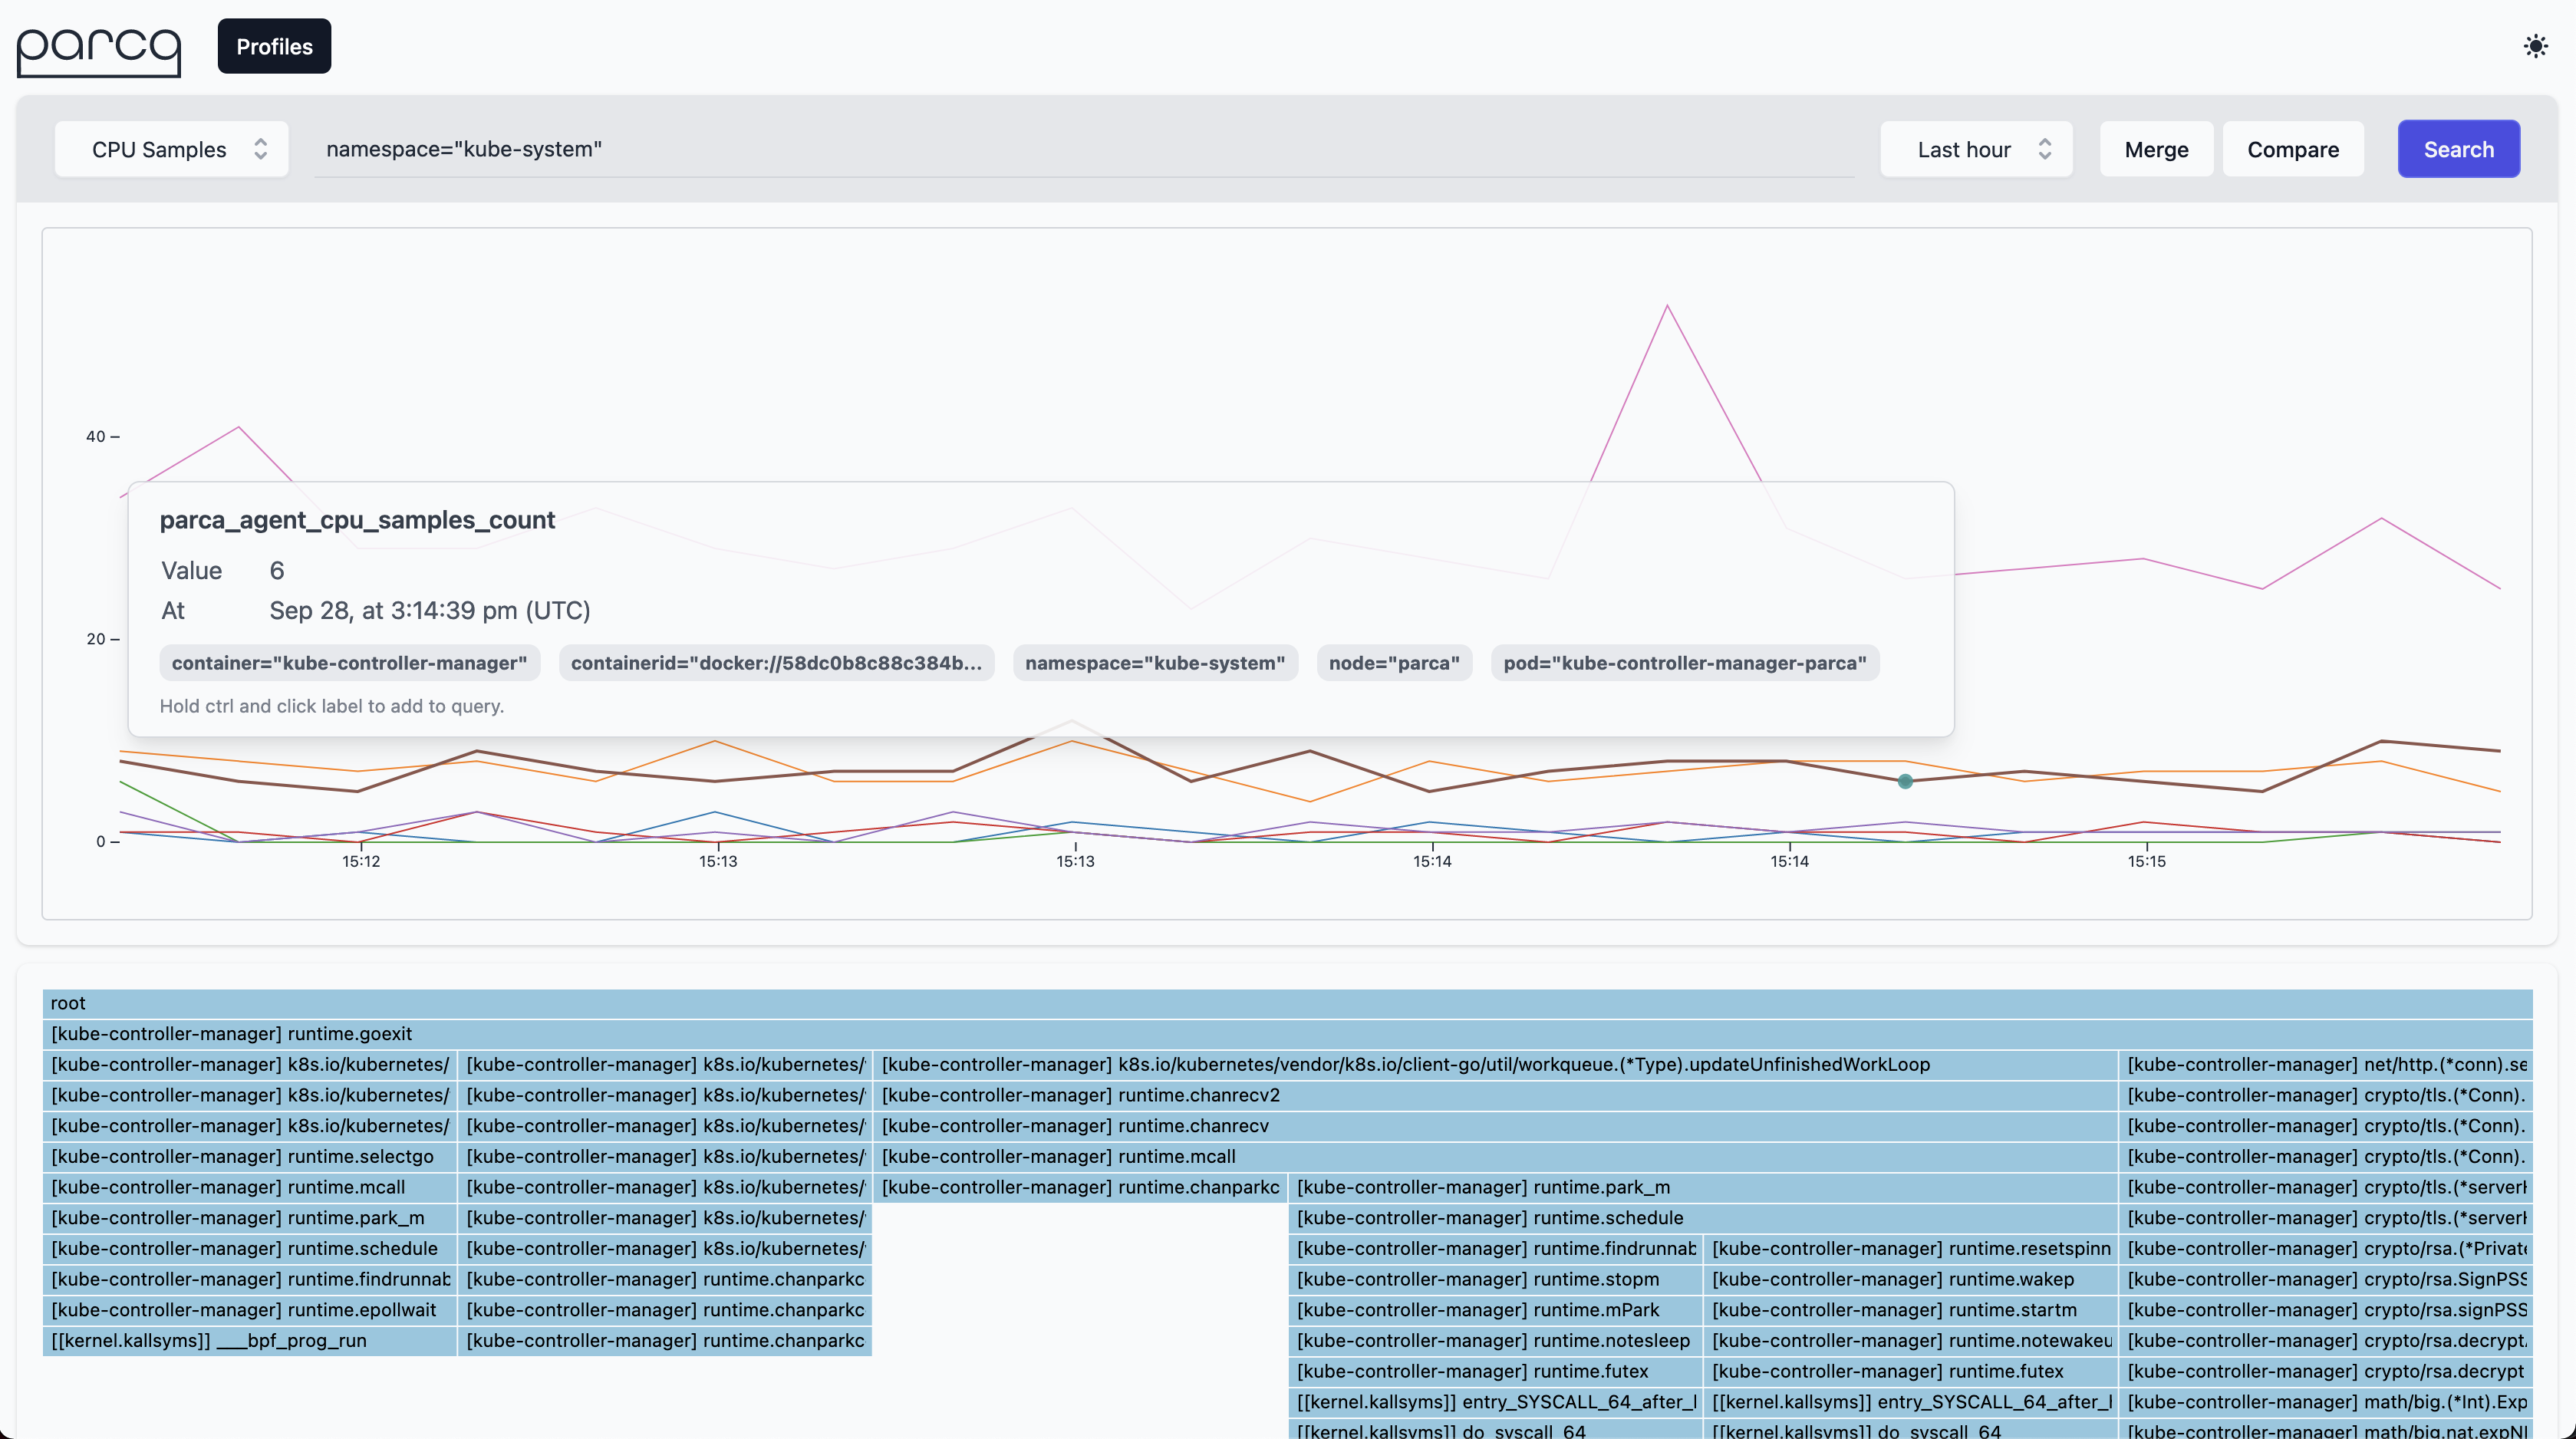
This should result in a time series based on the profile that is interactable. Clicking anywhere on the line graph should then bring up a Flame Graph for the profile that you've selected.
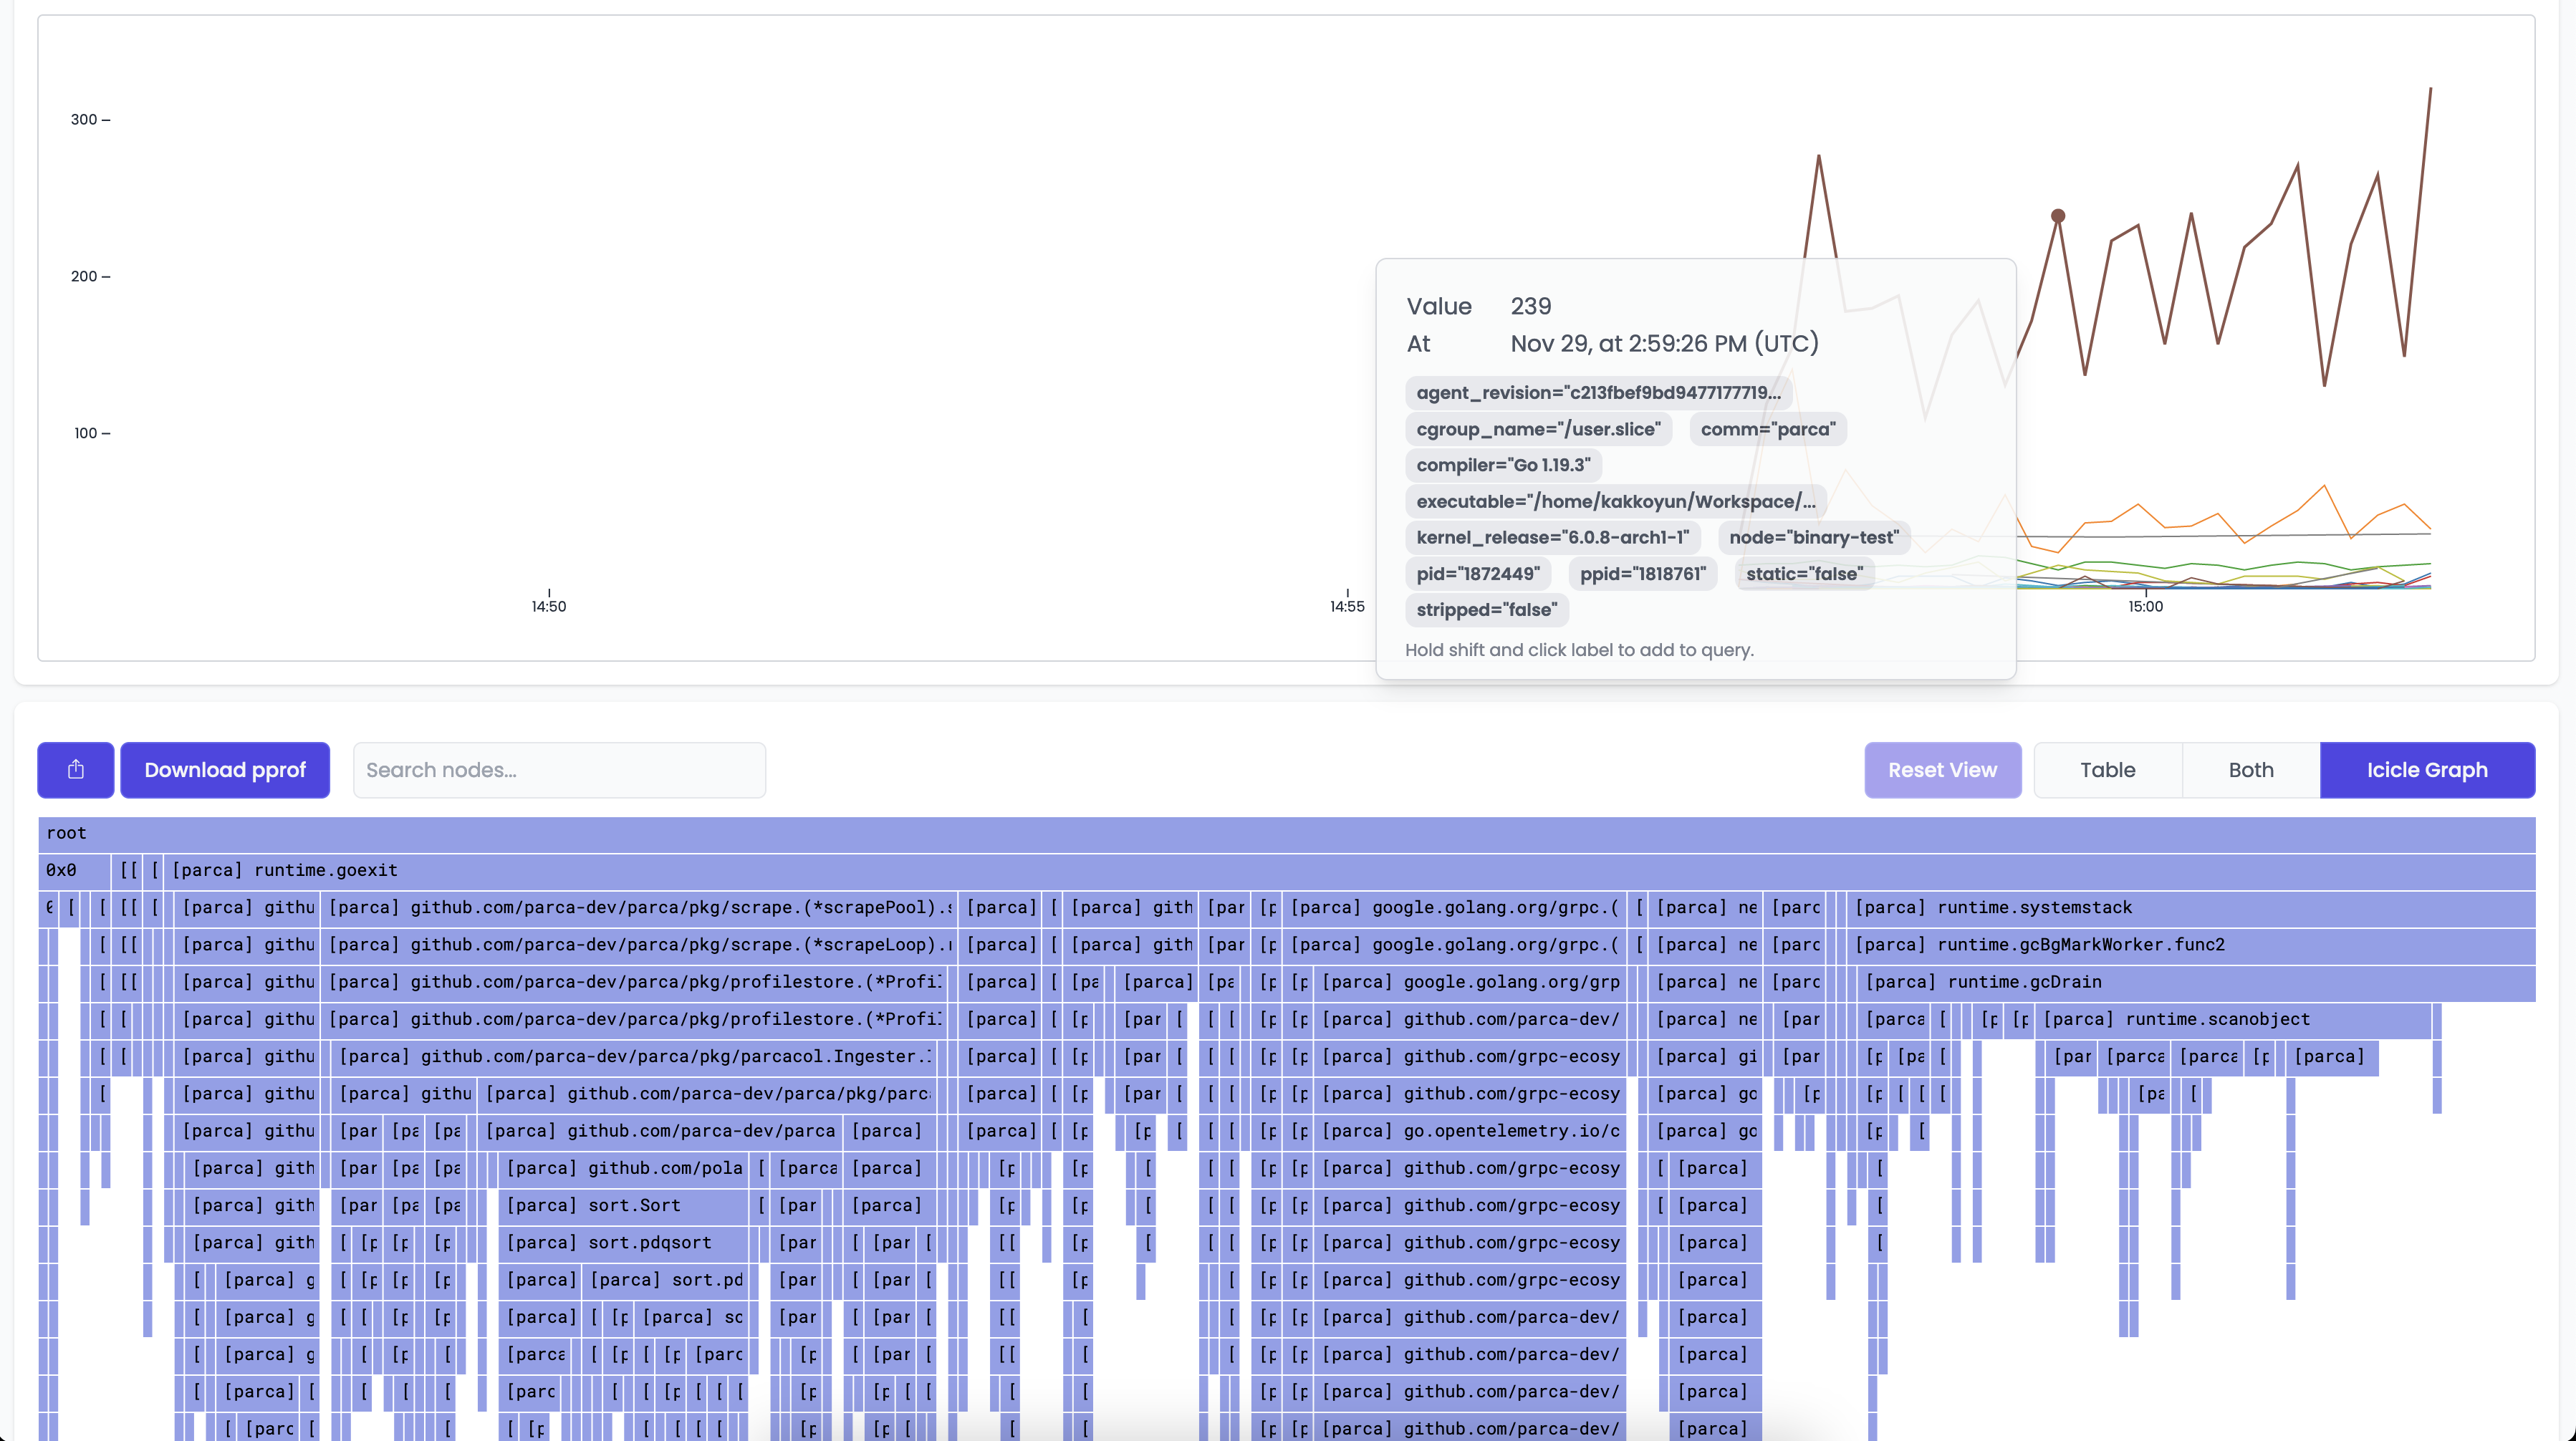
You can then interact with the Flame Graph to better understand how Parca is behaving.
One of the cool features of Parca Agent is by default it discovers all the containers run on the nodes that it's been deployed.
So out of the box you should be seeing all the system containers running on the system.
If you go to query bar and enter namespace="kube-system" you can focus on them.
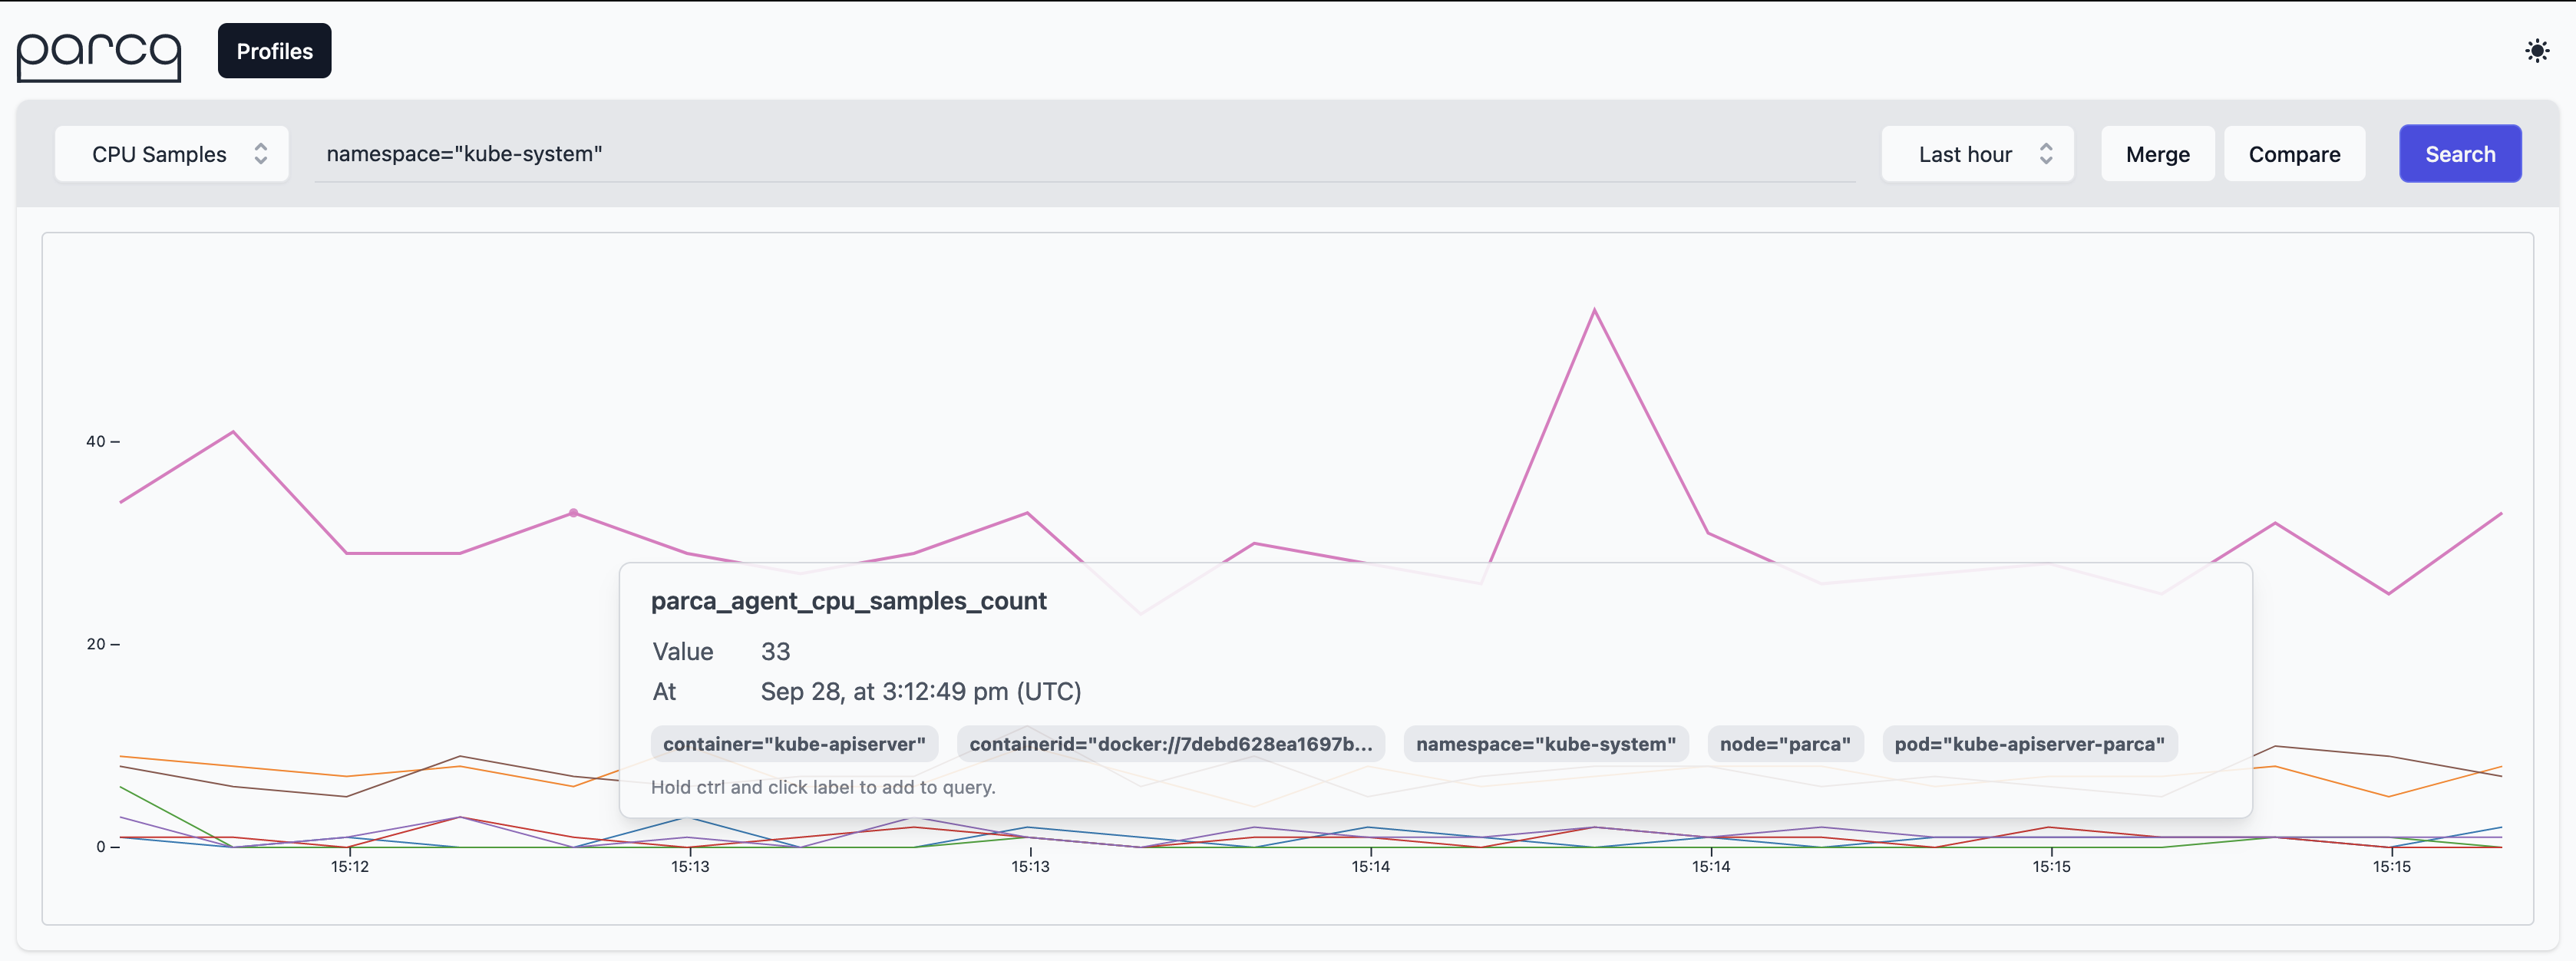
And you can click the samples on the graph to focus on the individual profiles.
Selecting a subset of applications to profile
Metadata discovery mechanism enriches the collected profiles with Kubernetes labels. You can use relabelling feature of the Parca Agent to drop a subset of labels. Agent utilizes the exact same labelling mechanism Prometheus provides.
To learn more about relabelling please see the Prometheus relabel_config documentation.
First you need to specify a configuration file if you haven't already. The relevant manifest changes on parca-agent-daemonSet.yaml would like the following:
...
template:
  metadata:
    labels:
      app.kubernetes.io/component: observability
      app.kubernetes.io/instance: parca-agent
      app.kubernetes.io/name: parca-agent
  spec:
    containers:
    - args:
      - /bin/parca-agent
      - --log-level=info
      - --node=$(NODE_NAME)
      - --remote-store-address=parca.parca.svc.cluster.local:7070
      - --remote-store-insecure
      - --remote-store-insecure-skip-verify
+     - --config-path=/etc/parca-agent.yaml
      - --temp-dir=/tmp
...
For brevity, we skip the details of mounting a ConfigMap with relevant content to /etc/parca-agent.yaml location.
For example, to only profile Pods with the app.kubernetes.io/name=my-web-app label, the relevant configuration file /etc/parca-agent.yaml would like the following:
relabel_configs:
  - source_labels: [app_kubernetes_io_name]
    regex: my-web-app
    action: keep
Pay attention to how label names are sanitized. app.kubernetes.io/name becomes app_kubernetes_io_name