Observability for Parca
Parca supports four pillars of Observability. Monitoring, Logging, Tracing, and Profiling.
Profiling
Parca by default scrapes its own pprof endpoints on localhost:7070/debug/pprof. The different types of profiles are available via Parca's UI.
Logging
Parca logs are structured by default. Parca's log level can be configured with --log-level="info".
Tracing
Parca has tracing for some of its functionality. You can configure the OpenTelemetry collector with --otlp-address=STRING.
For a local setup with Jaeger check scripts/local-tracing/.
Monitoring
Parca exposes Prometheus metrics on localhost:7070/metrics.
Parca's monitoring is mostly focused on read and write requests to Parca.
For that reason the grpc_server_handled_total is the most important metric for Parca and most of the other metrics and helpful for debugging overall.
There are some FrostDB specific metrics that are useful to monitor as well.
| Metric | Description | Type |
|---|---|---|
frostdb_granules_compactions_total | Number of per table compaction events that have occurred. | counter |
frostdb_granules_created_total | Number of per table granules that have been created. | counter |
frostdb_blocks_rotated_total | Number of per table blocks that have rotated out. | counter |
frostdb_active_table_block_size | The estimated size in bytes of each tables active block size. | gauge |
frostdb_row_insert_size | Per table tracking of the size in bytes of rows inserted. | histogram |
frostdb_thanos_objstore_bucket_last_successful_upload_time | If bucket storage is enabled, the last successful upload to the bucket. | gauge |
frostdb_thanos_objstore_bucket_operation_failures_total | Total number of bucket operations that have failed. | counter |
frostdb_tx_high_watermark | The transaction number that is safe to read up to. | gauge |
Service Level Objectives
Here are some example Service Level Objectives for Parca.
| Category | SLI | SLO |
|---|---|---|
| Write | ||
| Availability | The proportion of successful ProfileStoreService.WriteRaw requests (such as from Parca agent), as measured by Parca's gRPC metrics interceptor. | 99.9% in 4w |
| Latency | The proportion of sufficiently fast requests to ProfileStoreService.WriteRaw, as measured by Parca's gRPC metrics interceptor. | 95% of requests in < 100ms in 4w |
| DebugInfo | ||
| Availability | The proportion of successful DebugInfoService.Upload requests, as measured by Parca's gRPC interceptor. | 99% in 4w |
| Latency | The proportion of sufficiently fast requests to DebugInfoService.Upload, as measured by Parca's gRPC metrics interceptor. | 95% of requests in < 30s in 4w |
| Availability | The proportion of successful DebugInfoService.Exists requests, as measured by Parca's gRPC interceptor. | 99% in 4w |
| Latency | The proportion of sufficiently fast requests to DebugInfoService.Exists, as measured by Parca's gRPC metrics interceptor. | 95% of requests in < 100ms in 4w |
| Query | ||
| Availability | The proportion of successful QueryService.Query requests, as measured by Parca's gRPC interceptor. | 99% in 2w |
| Latency | The proportion of sufficiently fast requests to QueryService.Query, as measured by Parca's gRPC metrics interceptor. | 95% of requests in < 1s in 2w |
| QueryRange | ||
| Availability | The proportion of successful QueryService.QueryRange requests, as measured by Parca's gRPC interceptor. | 99% in 2w |
| Latency | The proportion of sufficiently fast QueryService.QueryRange requests, as measured by Parca's gRPC metrics interceptor. | 95% of requests in < 100ms in 2w |
| QueryLabels | ||
| Availability | The proportion of successful Query Labels requests to Parca, as measured by Parca's gRPC interceptor. | 99% in 2w |
| Latency | The proportion of sufficiently fast Query Labels requests handled by Parca, as measured by Parca's gRPC metrics interceptor. | 95% of requests in < 100ms in 2w |
Parca considers gRPC codes Aborted, Unavailable, Internal, Unknown, Unimplemented, DataLoss as errors. Every other gRPC code is considered successful.
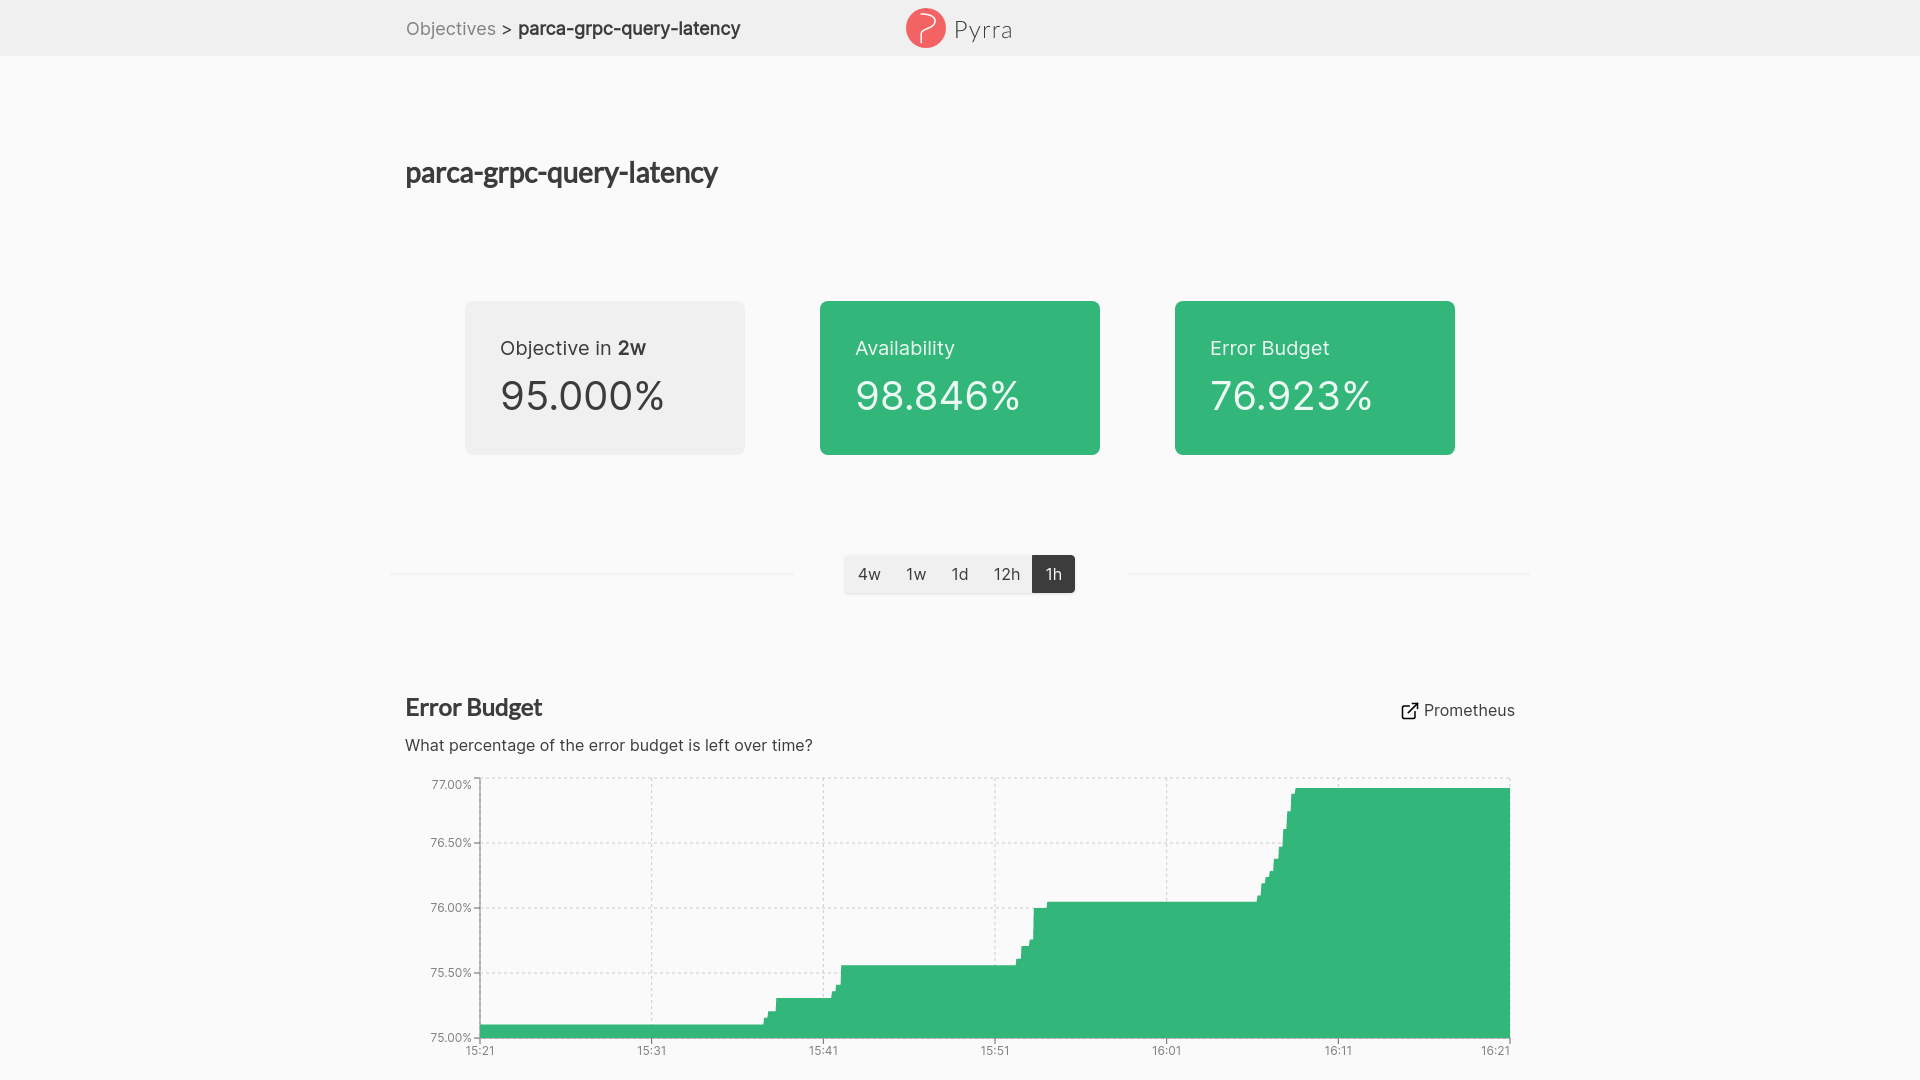
Pyrra
Parca contains Service Level Objective files for Pyrra. Pyrra will setup alerting based on the given SLOs and contains a UI for the most important aspects of these SLOs.
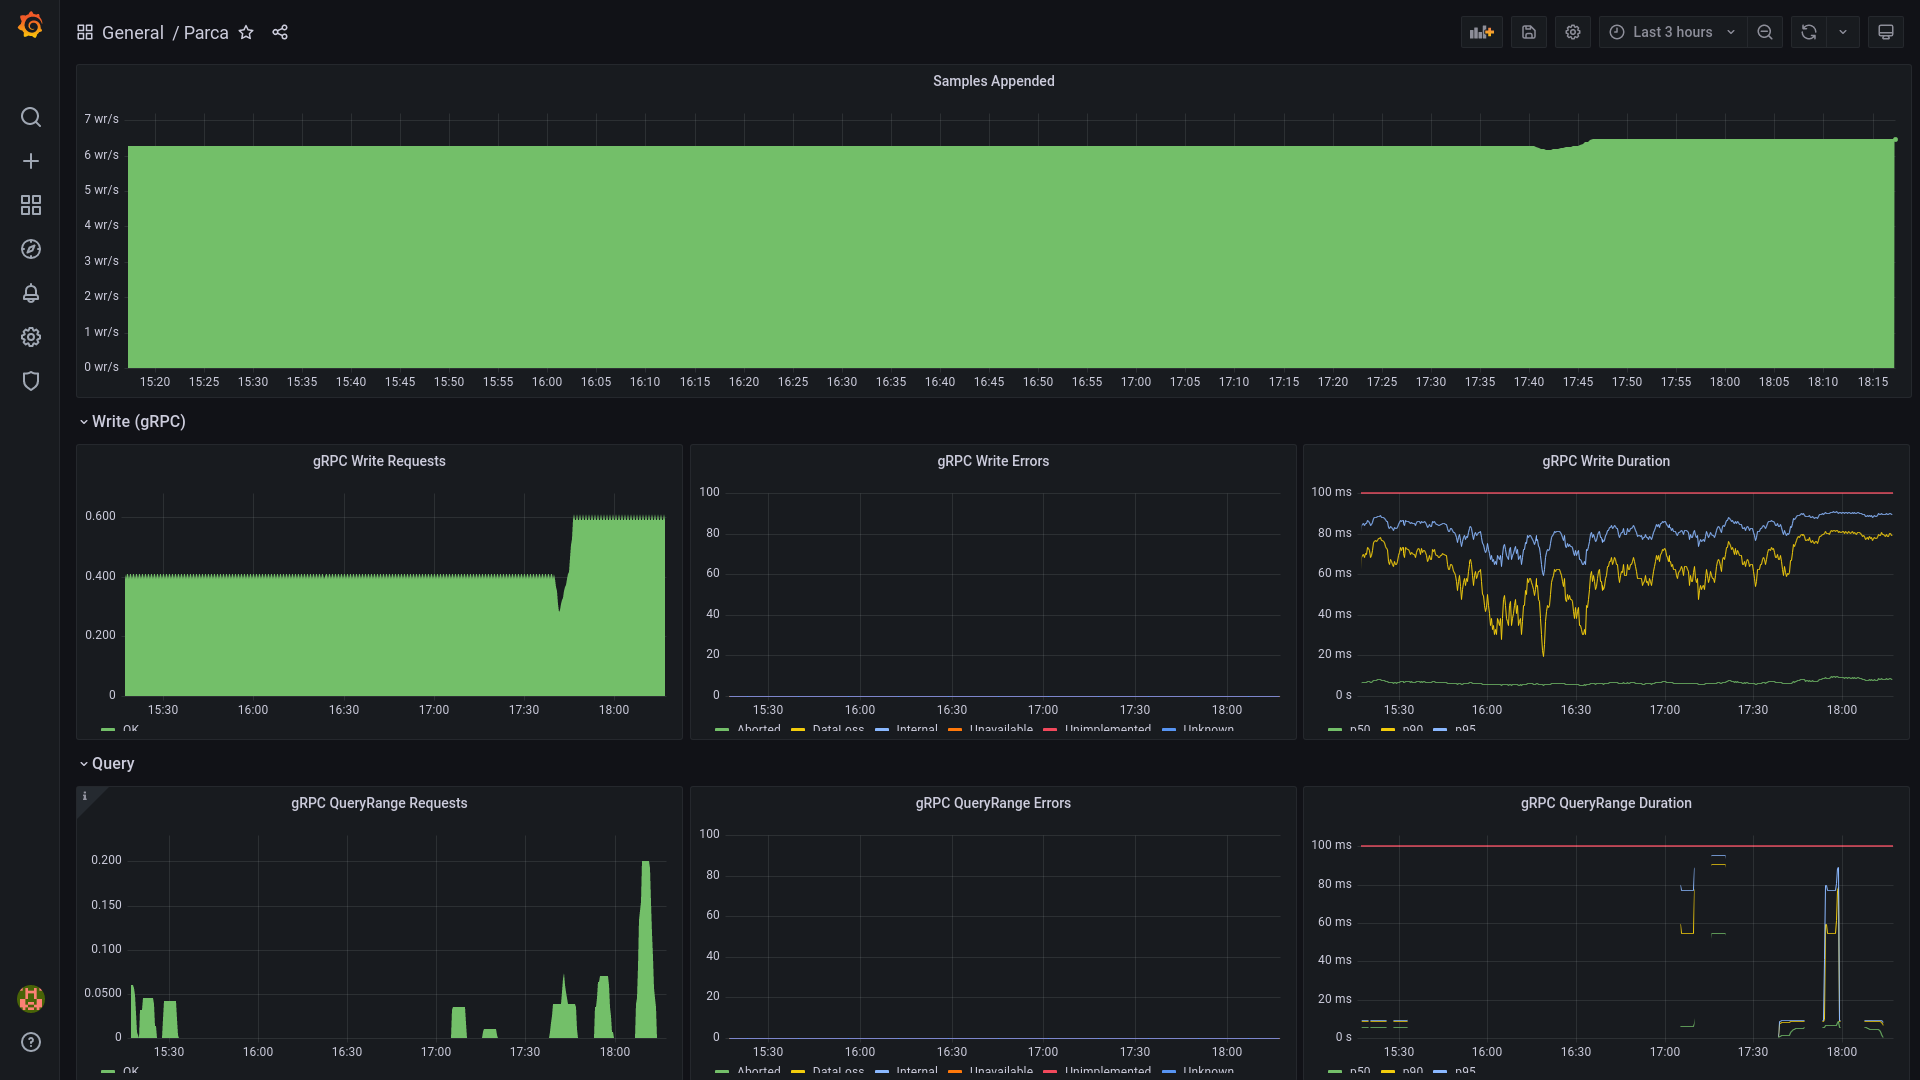
Grafana Dashboard
Parca ships with a Grafana dashboard that gives a good overview of Parca's state and should be a good entry point when troubleshooting. This dashboard should follow the above-given SLOs for Parca.